Find the lower and upper quartiles for the data set.
160 likes | 355 Vues
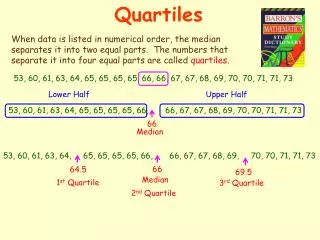
Learn how to find lower and upper quartiles, order data sets, calculate medians, and create box-and-whisker plots with step-by-step instructions. Practice with provided examples to enhance your understanding.

Find the lower and upper quartiles for the data set.
E N D
Presentation Transcript
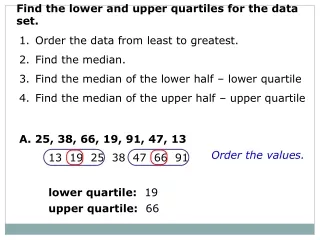
Find the lower and upper quartiles for the data set. • Order the data from least to greatest. • Find the median. • Find the median of the lower half – lower quartile • Find the median of the upper half – upper quartile A. 25, 38, 66, 19, 91, 47, 13 Order the values. 13 19 25 38 47 66 91 lower quartile: 19 upper quartile: 66
Find the lower and upper quartiles for the data set. 33 + 45 2 lower quartile: = 39 49 + 59 2 upper quartile: = 54 • Order the data from least to greatest. • Find the median. • Find the median of the lower half – lower quartile • Find the median of the upper half – upper quartile B. 45, 31, 59, 49, 49, 69, 33, 47 Order the values. 31 33 45 47 49 49 59 69
15 + 17 2 21 + 21 2 upper quartile: = 21 lower quartile: = 16 19 + 19 2 median: = 19 Example Use the given data to make a box-and-whisker plot. 21, 25, 15, 13, 17, 19, 19, 21 Step 1. Order the data from least to greatest. Then find the minimum, lower quartile, median, upper quartile, and maximum. 13 15 17 19 19 21 21 25 minimum: 13 maximum: 25
12 14 16 18 20 22 24 26 28 Step 2. Draw a number line and plot a point above each value from Step 1. 13 15 17 19 19 21 21 25
12 14 16 18 20 22 24 26 28 Step 3. Draw the box and whiskers. 13 15 17 19 19 21 21 25
31 + 33 2 24 + 26 2 upper quartile: = 32 lower quartile: = 25 29 + 31 2 median: = 30 Try It Out! Use the given data to make a box-and-whisker plot. 31, 23, 33, 35, 26, 24, 31, 29 Step 1. Order the data from least to greatest. Then find the minimum, lower quartile, median, upper quartile, and maximum. 23 24 26 29 31 31 33 35 minimum: 23 maximum: 35
22 24 26 28 30 32 34 36 38 Use the given data to make a box-and-whisker plot. Step 2. Draw a number line and plot a point above each value. 23 24 26 29 31 31 33 35
22 24 26 28 30 32 34 36 38 Use the given data to make a box-and-whisker plot. Step 3. Draw the box and whiskers. Step 2. Draw a number line and plot a point above each value. 23 24 26 29 31 31 33 35
Find the lower and upper quartiles for each data set. 48, 52, 68, 32, 53, 47, 51 lower = 47; upper = 53
78 87 91 94 98 Use the following data 91, 87, 98, 93, 89, 78, 94 Make a box-and-whisker plot.