Download
1 / 33
330 likes | 465 Vues
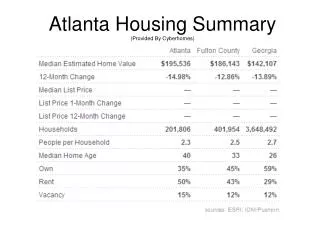
Dynamic Ride-sharing Systems: a Case Study in Metro Atlanta. Niels Agatz Joint work with Alan Erera, Martin Savelsbergh, Xing Wang ARC February 26, Atlanta. Motivation. Observations Congestion is a major issue in urban areas around the world Congestion leads to Loss of productivity

E N D
Dynamic Ride-sharing Systems: a Case Study in Metro Atlanta Niels Agatz Joint work with Alan Erera, Martin Savelsbergh, Xing Wang ARC February 26, Atlanta
Motivation • Observations • Congestion is a major issue in urban areas around the world • Congestion leads to • Loss of productivity • Wasted fuel • Pollution • Private car occupancies are low • Average of 1.8 for leisure trips • Average of 1.1 for commuting trips
Motivation • Opportunity • Effective use of empty car seats can • Reduce congestion • Reduce fuel consumption • Reduce pollution • Increase productivity • Enabling technology exists • GPS-enabled mobile devices • Mobile-to-mobile communication • Route guidance technology Dynamic Ride-Sharing
Outline • Introduction to dynamic ride-sharing • A dynamic ride-share setting • Solving the problem • Simulation Metro Atlanta • Simulation Results
Dynamic ride-sharing: basics • Announcement of trips • Matching of drivers and riders • Execution of identified trips • Sharing of trip costs Assumption: if no trip is identified, drivers and riders use their own carto reach destination
Dynamic ride-sharing: features • Dynamic: established on short-notice • Non-recurring trips: different from carpooling • Automated matching: different from online notice-boards • Independent drivers: different from taxis • Cost-sharing: variable trip related expenses • Prearranged: different from spontaneous, casual ride-sharing
Dynamic ride-sharing: providers • IPhone applications: • Carticipate (Aug. ‘08) • Avego (Dec. ‘08) • Google Android applications: • Piggyback (May ‘08) • Web-based: • Zebigo, PickupPal, Nuride, Rideshark, Ridecell, Goloco, Zimride, …, etc.
What is in it for participants? • Save costs by sharing fuel expenses and tolls • Save time through use of HOV-lanes • Save the planet
What is in it for providers? • Private: take a cut of the participant’s cost savings • Public (society): decrease external costs of transportation: emissions, pollution, and traffic congestion
Objectives • Participants: ↓ travel costs • Private ride-share provider: ↓ total travel costs ↑ cut • Society: ↓ pollution and traffic congestion • Objectives are aligned:↓ system-wide vehicle miles, win-win-win
Ride-share Setting Trip Announcement: • Trips between origin - destination • Role: driver, rider or flexible • Participant wants to save $ • At most: a single driver - a single rider • No Transfers or multi-passenger trips
Announcement: Time Information Departure time Announcement time Earliest Latest arrival time Latest Lead-time flexibility direct travel time time window for matching Relative to duration of trip?
Round Trips • Most trips in practice are round trips • Announcement round trips: jointly or separately? • Rider may want assurance return ride before departure • Return trip alternatives?
System Dynamics • New announcements continuously enter and leave the system! • People leave because • ride-share was found • Announcement expired
Effectively Handling Dynamics • Run optimization at • specific time intervals; • After a given number of announcements. • Optimization Engine: • Input: trip announcements • Output: driver-rider matches • Commit tentative match as-late-as-possible! • shortly before latest departure of ride-share
Effectively Dealing with Dynamics Expired Run 1
Effectively Dealing with Dynamics Ride-share finalized Run 2
Simulation Environment Based on traffic model data from ARC
Ride-share Characteristics Focus: Home-based Work, SOV • Ride-share participation rate (bc2%) • Driver – Rider ratio (bc1:1) • Announcement lead-time (abs) (bc30 min) • Time flexibility (abs) (bc20 min)
Announcement Generator • Randomly generate trip announcements based on o-d trip data: • 2024 Traffic Analysis Zones (TAZs) • # work-related round trips per day: 2.96 million • ~ 87% single occupancy trips • # O-D pairs: 2.90 million • max # trips per O-D pair: 881 • min # trips per O-D pair: 0.01
Announcement Generator cont’d Generate time information: • Home-work • Draw latest departure: 7:30am, sd. 1h • Calculate: earl. departure, lat. arrival, announcement • Work-home • Draw time at work: 8 hour, sd. 30 min • Add time at work to announcement times
Ride-share Scenarios • SEPAR: separate announcements for round trip, no guaranteed ride back • JOINT: joint announcement for round trip, guaranteed ride back (not necessarily with same driver!) • BOUND: all daily trips known upfront (no dynamics)
Simulation Results ! -0.6% of total trips -8.2
Sensitivity • Increase/ decrease participation rate More + better matches!
Sensitivity cont’d • Flexible roles →success rate ↑ • ↑ time flexibility → success rate ↑ • response time ↓ → success rate ↓ • ↑ lead-time → success rate ↑
Cost savings • Total daily system-wide savings: $53,000 • 20% cut Ride-share provider: $10,600 • Viable business model? • Avg. savings pp matched: $1.4 (20%) • Enough incentive to participate? Input: $0.55 per mile (AAA 2007)
Environmental benefits • System-wide vehicle-miles: -105,519 • Vehicle Trips: -15,400 Emissions • Hydrocarbons: -650 lbs/ day • CO: -4000 lbs / day • Oxides of Nitrogen: -323 lbs/ day
When can we find ride-shares? Density is good
What if we offer awards? Subsidize ride-share by a fixed award per match No award Award = $0.55 Award = $1.10 +8% +2.5% $9,500 $19,000
Under development • Study system performance over time • Key observations: • New participants try ride-sharing • Dissatisfied participants may stop announcing trips • Inspired by innovation diffusion models: • Inflow new users dependent on size of user pool! • Outflow depends on cumulative success rate
Outlook • More realistic travel time settings • Time-dependent travel times • Behavioral modeling • Match acceptance • Cancelations • No-shows • Choices • …