Download
1 / 15
150 likes | 266 Vues
This guide provides a comprehensive overview of the differences between securities exchanges and indices. Exchanges are platforms where transactions occur, while indices are metrics used to gauge market performance. Notably, indices often reflect the performance of stocks on specific exchanges like NYSE or NASDAQ. We delve into popular global exchanges, key market indices like DJA and S&P, and the significance of annual reports and SEC filings from individual stocks. Learn how to interpret market data and stay informed on valuations, analyst reports, and earnings expectations.

E N D
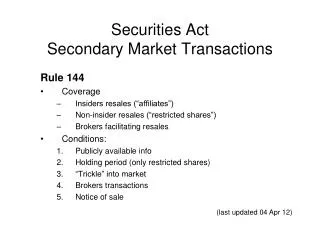
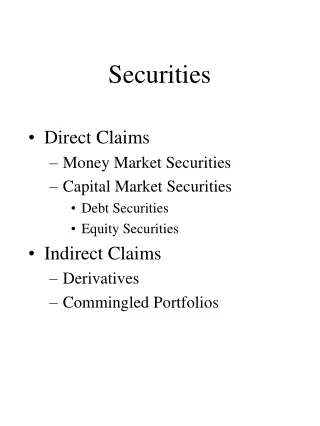
Exchanges vs. Indices • Exchanges are where the transaction takes place • Index is a measurement of performance • Sometimes an Index measures performance of stocks on a specific Exchange • Don’t get confused about this…
Popular Exchanges • NYSE • Amex • Nasdaq • Philly • Pacific • London • Tokyo • Hong Kong • Other worldwide exchanges • After-hours / Electronic exchanges
Indices • DJA • S&P • NYSE • AMEX • NASDAQ • Wilshire • Russell
Dow Jones • Industrial (Reliability? Some say yes, some say no….) • Transportation • Utility • Composite (three above)
Standard and Poor’s • Industrial (400) • Transportation (20) • Utility (40) • Financial (40) • Composite (500) • Midcap (400) • Smallcap (600) • Composite 1500 • Comparison with Dow (Index vs. Average, Breadth, Accuracy…some argue Dow close enough)
Exchange-Related Indices • NYSE Indices • Amex • Nasdaq
Wilshire Indices • Attempt to reflect the total market value (captures approx. 99% of total market value) • A point is worth $1Billion • Wilshire reading of 10,000 = $10 Trillion in total value
Russell 2000 • Measure of small stocks’ performance
Individual Stock Data • Wall Street Journal • Barrons • Investor’s Business Daily • Multiple On-line Sources • Hi/Lo, Close, Last, Bid/Ask, P/E, Div, Yield, Volume, Shares Outstanding
Annual Shareholder Reports • Reports include key business fundamentals and financial data • Operating detail • Financial discussion
SEC Filings • Financial Statements • Other documents • Key source of information for publicly traded corporations • Edgar Database
Analyst Reports • Upgrades / downgrades • Buy / Strong Buy / Hold • When does buy mean sell? • Earnings Expectations (Meet/Beat/Die)
Information On Individual Stocks • On-line sources • Value-line-valueline \ education \howto • Morningstar—Stock selector • S&P • Barron’s • WSJ (Zack’s) • Bloomberg
How much is a stock worth? • When is a stock overvalued? • When is the MARKET overvalued? • Earnings multiples… • Bulls vs. Bears • When should you care?