Analysis of Cosmic Ray Density Distributions and Cylinder Orientation Affected by Solar Wind
This study examines the cylindrical density distribution of cosmic rays (CR) with an axial symmetry and its interaction with the solar wind. By assuming a Gaussian distribution, we derive the velocity of the cylinder using the apparent solar wind velocity. Observations from two coronal mass ejection (CME) events in 2001 are analyzed to determine the best-fit parameters (I0 and l) for CR gradients at Earth. Results indicate varying densities and orientations during two significant CME events, providing insights into cosmic ray behavior influenced by solar activity.

Analysis of Cosmic Ray Density Distributions and Cylinder Orientation Affected by Solar Wind
E N D
Presentation Transcript
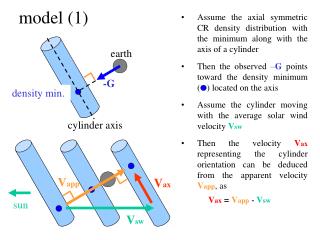
earth -G density min. cylinder axis Vapp Vax sun Vsw • Assume the axial symmetric CR density distribution with the minimum along with the axis of a cylinder • Then the observed –G points toward the density minimum ( ) located on the axis • Assume the cylinder moving with the average solar wind velocity Vsw • Then the velocity Vax representing the cylinder orientation can be deduced from the apparent velocity Vapp, as • Vax =Vapp - Vsw model (1)
R earth λ -G RE density min. cylinder axis model (2) • Assume the gaussian distribution for CR density, as (1) R : distance from the cylinder axis I0 : minimum density, l: radial scale of the cylinder • Then G(RE) observed at the earth (R= RE) is… (2) RE: minimum distance between the earth & the cylinder axis • With the observed G(RE), REcan be calculated • from (2) for each set of parameters, I0 & l • Find a set of I0 & l giving the best-fit G(RE) to • the observed gradient
CR data used Prototype Muon network 35 directions (Nagoya-Japan, Hobart-Australia, SaoMartinho-Brazil) Two CME events in 2001analyzed S.Watari 2002
Observation 4/11 8/27 ρGx ρGy ρGz
Results for Apr. 11 event averages over the best-fit period: Vsw = 696 km/s B = 21.2 nT r = 0.053 AU cylinder orientation : q = 50.2 f = -5.2 passed the earth at RE= 0.015 AU best-fit parameters : I0 =-1.93 % l = 0.066 AU
Results for Aug. 27 CME averages over the best-fit period: Vsw = 533 km/s B = 7.4 nT r = 0.15 AU cylinder orientation : q = 66.4 f = -33.3 Passed the earth at RE= 0.025 AU best-fit parameters : I0 = -1.02 % l = 0.061 AU
Density profiles Apr. 11 CME Aug. 27 CME
Results for Apr. 11 eventby NM averages over the best-fit period: Vsw = 696 km/s B = 21.2 nT r = 0.011 AU cylinder orientation : q = 148.9 f = 15.7 passed the earth at RE= 0.030 AU best-fit parameters : I0 =-10.0 % l = 0.085 AU
Results for Aug. 27 CMEby NM averages over the best-fit period: Vsw = 533 km/s B = 7.4 nT r = 0.030 AU cylinder orientation : q = 57.9 f = -26.4 Passed the earth at RE= 0.047 AU best-fit parameters : I0 = -6.189 % l = 0.098 AU
Density profiles by NM Apr. 11 CME Aug. 27 CME