Download
1 / 23
230 likes | 253 Vues
Explore the challenges and strategies of comparing different value criteria when investing in highway assets. Learn how to allocate resources effectively to achieve the best outcomes.

E N D
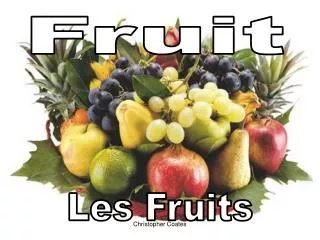
Where should we invest?orcomparing apples with oranges Garry Sterritt Asset Investment Manager, Roads Directorate, Transport for London
Apples vs. oranges!! • It’s like comparing apples to oranges!! • This is a logic fallacy • A particularly deceptive argument which seems correct • ...but upon further examination is found to be incorrect • We compare apples and oranges all the time!! • How do you value an apple to an orange? • Cost / offers • Taste - personal preference • Ease of access! • Filling effect, etc. • These are your Value Criteria • Common criteria enable an objective and fair comparison
...the same holds true for highways • We all have a diverse asset base • ...but they all serve a common purpose
What are the questions & criteria? • What are we trying to answer: • How much should we invest in our highway assets? • Where do we invest to get the best outcomes? • What defines our value criteria? • Goals and objectives: Mayor’s Transport Strategy • Vision for TfL Roads Directorate: Safe, reliable and cared for streets
Two questions: Common Value Criteria How much to invest? Asset Investment Planning Where to invest? Value Management Analyse condition data Budget Asset inventory & condition data Network intelligence Asset deterioration models & cost data Asset budgets & strategies Investment scenarios & strategies Identify candidate schemes • Common Value Criteria • Safety Risk • Function Risk • Financial Analyse and compare investment options Rate & cost schemes & options Agreed budget, asset splits & asset strategies Prioritised programme of works
Common Currency • “It’s easy to have common Value Criteria, but they are not directly comparable between assets” • For example, if condition data informs safety or customer satisfaction, then: • Carriageway – SCANNER, DVI, SCRIM, CVI • Footway – CVI, DVI • Bridges – BCI • Lighting columns – structural testing • Trees – condition survey • All have different scales, meanings, collection techniques etc. • So the Value Criteria need to be translated to and expressed on a common currency, e.g. £££
How do you translate asset information to a common currency? • The magic formula is as follows: • Commitment from key/senior staff • Staff time and resources • Use real world examples, across all asset types, to support discussions and decisions • Understand the differences between asset types • Bring domain experts together • ...and locking them in a room until they agree! • It is challenging and we are only part way along our journey
Asset Investment Planning:Balancing Safety Risk, Cost & Satisfaction • Strong correlation between SOGR and Customer Satisfaction • SOGR has a major impact on WLC (Capital and Revenue) • SOGR of bridges and structures has a lower impact on customer satisfaction • A low SOGR results in higher risk exposure
Our approach • Complex analysis due to number of assets and variables involved, e.g. • Deterioration over a 10 to 20 year period • Treatment options, costs and effects • Budget constraints vs. performance targets • We needed an Investment Planning Model that could cater for all asset types • Generic framework that enables the asset, its state, deterioration, costs and strategies to be defined • Enables different asset types to be analysed in the model at the same time, i.e. budget trade-offs
What does the customer want? • We asked road users, in face-to-face surveys: • To identify their preferred intervention level • To identify their minimum acceptable intervention level
Value Management • Value Management - a systematic approach for identifying, assessing, prioritising and optimising a portfolio of projects, based on an agreed set of Value Criteria, which maximises contribution to the business objectives for a defined budget • A process for ensuring fair allocation of resources, taking account of value drivers and scheme specific information
Value Management Criteria • Safety – the risk posed to the public • Functionality – the risk to network performance; including but not restricted to, availability and reliability • Environment – the risk posed to the environment • Financial – providing WLC savings considering both direct costs to TfL and indirect costs to the economy Risk Scoring Financial Scoring
Value Management documentation • Value Management of the capital programme • Part 1. Overview • Part 2. Carriageways • Part 3. Footways • Part 4. Structures • Part 5. Tunnels • Part 6. Lighting • Part 7. Drainage • Part 8. Safety barriers • Part 9. Green estate
Where to Spend: Optimising Forward Programme Carriageway • Optimise risk for the defined budget • Each scheme has several options where risk and cost are evaluated for each Optimise Option 1 Option 1 Option 1 Option 1 Option 1 Option 1 Option 1 Option 1 Option 1 Scheme F Scheme A Scheme B Scheme G Scheme C Scheme D Scheme E Scheme I Scheme H Option 2 Option 2 Option 2 Option 2 Option 2 Option 2 Option 2 Option 2 Option 2 Option 3 Option 3 Option 3 Option 3 Option 3 Option 3 Option 3 Option 3 Option 3 Optimum Bundle Structures c/w Scheme B Option 1 c/w Scheme C Option 3 str Scheme D Option 2 str Scheme E Option 3 str Scheme F Option 1 Lighting lig Scheme H Option 2
VM cross-asset matrix Drainage C/W & F/W Structures & Tunnels Lighting
Updated VM Matrix • Not a theoretical paper exercise • Developed through workshops using real examples and attended by domain experts
Conclusions • You can compare apples with oranges • You can compare different highway assets • ...but it takes some work to develop/embed the process • You need a common set of Value Criteria, a common currency and commitment • Don’t expect it to be perfect • It can evolve and be refined over time • It provides a fair and objective basis for: • Determining investment needs; and • Prioritising investment