Download
1 / 48
480 likes | 500 Vues
Presentation on water transfers in Colorado, addressing impacts, regulations, and future considerations. Explore water resource issues and potential solutions for sustainable water management in the region.

E N D
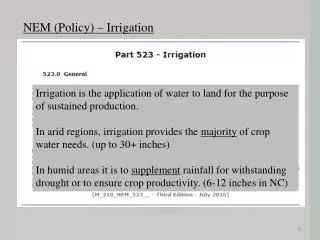
Taking Water From the Farm: A Framework for Considering Water Transfers From Irrigation Presentation Seeking Comment John Wiener <John.Wiener@Colorado.Edu> Loosely Affiliated with University of Colorado and NCAR (please contact if hand-outs are gone) to Universities Council on Water Resources July 2008, Durham, North Carolina Acknowledgement: NOAA SARP funding Minor editing for posting; references in “speaker notes” Notes: Water Transfer Guidelines Committee Report was not final when this presentation was made. Some photos are deleted because of overlap with AWRA 2008 presentation posted.
IF this is an answer, what was the question? Assessment of impacts from moving water is not required in Colorado (not unusual!) unless there is a significant federal nexus… Cumulative impact assessment is almost entirely absent (of any kind of impact) Mitigation of impacts is not generally required (without federal policy, e.g. wetlands) Want cheap, voluntary, PR-favorable steps
2003 – NOT CONSIDERING CLIMATE DESTABILI- ZATION – WHAT GROWTH WILL DO… (OPTIMISTIC!) “…water supplies are or will be inadequate to meet water demands, even under normal water supply conditions.”– U.S. Dept. of Interior Water 2025
IRRIGATION DENSITY – THERE IS A LOT OF IT! this is just to show extent STILL MORE THAN 80% OF THE CONSUMPTIVE USE OF WATER IN THE WEST 1997 Data – Map from Gollehon and Quinby, 2000 Water Resources Development 16(2)
Housing Density Change 1960 - 2050 (Tom Dickinson, C.U. Center for American West, and IBS Social Sciences Data Analysis Center)
(Center of the American West, on the internet with two other cases) Colorado Front Range
Ag water is still cheap! Very few above-ground storage sites left… even if you have water to store This is for the sale of water rights, not one use or a lease From Denver Water Integrated Resource Plan, and in Luecke et al., 2003, What the Current Drought Means for Colorado… (on-line from Trout Unlimited, Colorado)
$700 to $1400 “retail” prices not counting tap fees, etc… Even with ethanol… WATER WILL MOVE This is likely not correct - with inclining block rates, prices may be higher in most if not all cities.
South Platte North Platte Yampa/White/Green 10,300 AF Gap 107,800 AF Colorado 107,600 AF Identified Projects 404,300 AF Gunnison Dolores/ San Juan/ San Miguel Rio Grande Arkansas 2030 M&I Water Demands and Gaps (Colorado Statewide Water Supply Initiative slide -- except for comments) Beware! Self- reported “identified projects”! – --- If the big ones fail, the “gap” soars… THIS “GAP” estimate may be way too cheerful! – Climate destabilization ignored here too…
12 to 23% of what’s left – or more ? ! BIG questions about this: water to acres varies, and the basis of the demand estimate is uncertain… And, no climate effects! SWSI slide
The water “distributary” infrastructure created much of the current riparian environment! (Water Resources Impact, May 2008) and source of great real estate value in urban areas! See work of Robert Crifasi – the amazing ONE percent… IF IT’S A LAKE, IT’S A FAKE
Conversion of Best Farm Land – Near Loveland, in Weld County, CO I-25 BoydLake One square mile NOT A SHORTGRASS STEPPE NOW! Slide by Tom Dickinson, IBS and Geography, Source: National Agriculture Imagery Program (NAIP),USDA-FSA Aerial Photography Field Office
March 2006 http://www.environmentcolorado.org/envco.asp?id2=23275
An ironic diversion... Name source and date for prize yet to be determined. Contest in honor of Ed Sarachick.
not-fun facts (Pimentel 2006, etc) • 90% of US cropland is losing soil faster than it can be restored; 75% of range needs help • ~ 1/3 of US topsoil was lost 30 years ago (Pimentel 1980) • HALF of Iowa’s topsoil is gone – and still losing average 30 t/ha/yr (soil formation rate 0.5 to 1 t/ha/yr) • 40% of Palouse topsoils were gone, 1995 • Costs to US, 2001: ~$37.6B/yr (but not with good ecosystems valuation or replacement of services costing) • $20B/yr for fertilizer replacement for lost nutrients (eroded soils take NPK away, as well as biological active fractions and potential) • And then there’s the incredible costs of pesticides, with 1000-fold increase in organophosphates (Pimentel 2005)
Not-fun facts… • On average, 1.5 kg of soil is lost in the production of 1 kg of corn in the U.S. cornbelt • Looks good compared to the Palouse: average there 20 kg lost per 1 kg wheat • Gardiner and Miller (Soils in Our Environment, 10th Ed., 2004: 409) • Their average erosion figures for US: • 1982: 7.3 tons/acre 1987: 6.9 tons/acre • 1992: 5.5 tons/acre 1997: 5.0 tons/acre (2004: 407) SPREAD OF NO-TILL HAS DOUBTLESS HELPED, BUT HERBICIDE USE WAY UP A note from October 2008– What now with input prices so high?
Money Talks…Crop Switching for ethanol(before the food price spikes in late ’07 and ‘08) LAND PRICES ARE WAY UP AND SO ARE PRICES FOR FERTI- LIZERS AND FUEL ETC ETC… THE AG PICTURE CAN CHANGE VERY QUICKLY!
Where the land is NOT CONVERTED to urban use? What is now happening to the farm-dependent areas? Howe et. 2003: RED CIRCLE: 26% of primary income from agriculture SOME ethanol relief, but Long-term questions – feed prices… messy… Population Growth is NOT evenly distributed
WEALTH and CAPACITY are not evenly distributed, either… but, CHILD poverty rates exceed 50% in only one county. d * What now with the ethanol boomlet? Hmmm… Who had the $$ to rapidly respond? Source: USDA ERS (downloaded 17 May 08) http://www.ers.usda.gov/Data/PovertyRates/PovListpct.asp?ST=CO&view=Percent
Arkansas River Basin in Colorado Map by Tom Dickinson, SSDAC, IBS, University of Colorado
The Green is HYBRID ECOLOGY – THE SUBSTITUTE See Water Resources Impact, May 2008 Data source: Landsat Enhanced Thematic Mapper, 2005. Map by Thomas W. Dickinson, Institute of Behavioral Science, University of Colorado at Boulder
Housing Density Change In Colorado 2000 - 2020 Housing Density Change 1960 - 2050 (C.U. Center for American West, Tom Dickinson) 2020 PEOPLE MOVING INTO THE RIPARIAN CORRIDORS 2000 David M. Theobald. “Targeting Conservation Action through Assessment of Protection and Exurban Threat.” Conservation Biology, 17(6):1624-1637. Dec. 2003
What was the question? Framework… • Very little information on many kinds of impacts • Very few required assessments, and then, accounting stance may be problematic, spatially, temporally, and… • The land use-water use connections are missing • And, much of (most of? almost all of?) the public interest is unstudied…
The Range of Impacts is Too Big! • Biological/Ecological – lots of categories • Economic evaluation questions – e.g. ecosystem services, irreversibility/ proper accounting stance/errors • Social/Human/Cultural Dimensions • Agronomy/Agricultural capacity/soil conservation/ industry structure/market turmoil vs. evaluation of impacts • Cumulative Impacts in all areas • Equity – who is limited when limits appear?
Where we start… way behind… • Prior Appropriation is Our Plan • “Private competitive market; disclosure optional ” • Policy Discussions and public research: 2003 on… • Statewide Water Supply Initiative • Basin Roundtables and Interbasin Compact Commission, 2006 on… looks nice, but… • “Breaking impasse, Denver utility, W. Slope cut deal…” (2007) (Talk while we make deals) • “Water expansion builds worries for some…” $3 Billion on projects, racing… (keep talking, please…)
Forthcoming, but…. • Arkansas Basin Roundtable, Water Transfer Guidelines Committee – • A hardy band, very mixed membership – ditch superintendent, former head of CO water quality control commission, two big city water officials, an engineer, an irrigator, the mayor of a small town in big trouble…and a bunch more (13 total at end)… COLLABORATIVE PROCESS – 20 months, mostly 2 days/month – >1400 hours, thousands of miles driven (big basin!)… • Facilitator Smith, anthropologist Weber, Wiener • 18 experts and officials who met with committee, usually for half-day sessions • Report release SEP 08…But: • Not quite far enough, and too intimidating?
Water Transfers Guidelines Committee • Preface material – explanation, issues • Premises and Underlying Issues: • present and future impacts • cumulative as well as immediate impacts • affected area is defined by the case • basis for comparison, and “adequacy” • “Adequate water for future municipal needs” • the land use and planning needs revealed! • environmental cumulative assessments • public information and public participation timing, disclosure, investment, water court…
Size of transfer relative to affected area Location of transfer relative to affected area Period of time to implement transfer Point of Diversion Time of Diversion Means of Conveyance Storage Issues Impact on environment Impact on recreation Economic impact on affected communities Non-economic social impacts (psych., health cultural, historical and aesthetic) Local government interests Length of lease Frequency of transfer Group transfer issues MISSING: Opportunities WTGC Template (unofficial!)
Worries… • Too Ugly? “You want me to do this????” • But, this is serious! Please??? Look Green! • Too complicated? • Maybe… depends on who is looking • Too expensive to assess? • Big public interests… public externalities… high costs of adverse impacts… • Too expensive to mitigate impacts? • Don’t know! Open questions… • And, missing one: CHANCE FOR BETTER which is in the hand-outs
What’s the state of the art? What does the library have to offer? • Look to literature about water projects and project evaluation • Some of the best economics is about how to do this… • Is there guidance we can afford to take? • Looked (1996 article) at flood policy projects… look again! • Second Law: No Program Cannot be Subverted.
Skeleton review – progress? • 1962: Policies, Standards and Procedures… Senate Doc. 97. Beyond BCA? Inform alternatives… long efforts • 1973: Water Resources Council: Principles and Standards for Planning Water and Related Land Resources – Rigorous accounting, comparability emphasis ??? • 1983: Principles and Guidelines – Rigorous accounting, theoretically improved, but not clear whether outcomes were improved
Skeleton review – progress? • 1989 and after… “Green Accounting” – Repetto and after –Honored idea, but… • 1994 National Research Council: Yes, but… And Soils treated! But… • 1999 National Research Council: Still, yes, but… not yet… high priority… but…
This will be an easy “sell” for people who are thinking about getting more information about soil moisture measurements… not!!! TABLE 8-1 Soil Attributes and standard methodologies for their measurement to be included as part of a minimum data set (MDS) for monitoring soil quality (adapted from Larson and Pierce, 1991). Pierce, F.J., 1994, Soil Quality in Relation to Value and Sustainable Management, Chapter 8 in National Research Council, Assigning Values to Natural Resources. METHODOLOGY FOR MEASURING SOIL ATTRIBUTE
TABLE 8-2 A Limited Listing of Proposed Pedotransfer Functions (adapted from Larson and Pierce, 1991). Any day now?
Conceptual progress, theoretical clarity and some examples of this are available… Cost?
We’re starting from almost scratch, in a state that has resisted foresight and the public interest… Is there any chance of much of this high-tech analysis? WAY too expensive! We’re begging here…
Foolrushery – start again…What’s involved in an answer? • Internalize costs, “real costs” • Recognize all interests (“AMAP”…) • Anticipate cumulative limits, thresholds • Recognize Accelerating Climate Destabilization • Recognize land use vs water quantity, quality • Address impacts in transferor areas; transferee areas represented already • AND, avoid the “Ideal is Mission Impossible” trap • AND, get enough public and participant “buy-in” to get some results!
Two Constants and the Low-Tech Social Welfare Function • Near-term Constant 1: Urban ability and will to pay -- for water AND ALSO for amenity, environment, open space, ag. preservation…. $24 billion locally voted in 5 years (US); $3.8B in Colorado so far, passing 110 of 148 measures (TPL) • Constant 2: Soil formation is very slow; climate is faster! • Suppose you owned all the pieces? What could you do to maximize the outcomes? • How to get to partnerships that can produce some of the potential better outcomes?
Modifying* Bebbington’s Five Capitals – as categories • Natural capital (resource base, quality) • Built capital (infrastructure, investments) • Financial capital (internal and external) • Human capital (individual capacities, local knowledge, craft knowledge) • Social capital (organizational and collective capacities) – let’s be brave and add legal/institutional issues – including those that affect public capacity to act * probably well out of his intentions…
Three Times to Consider • Near term – conventional economic analysis • some idea about prices, relative values • Mid term – 20-50 -? years? – the life span of bonded indebtedness, much of the water infrastructure, the sunk capital • Far term – the time scales for “sustainability” • some physical processes • beyond the discount rate… preferences • predictability limited to some constants • predictability for human activity very small
What a mess! Work back? • Some relief if we work backwards from Far • Far term: No regrets defense of the core! • For social capital? • knowledge (including local ecological/traditional) • technologies of production and clean-up • social continuity to maintain cumulation and to prevent loss • For human capital? not applicable – • Keynes’ long run
What a mess! Work back? • Some relief if we work backwards? • Far term: No regrets defense of the core! • For Built capital? Not much will last to the far term – BUT, chemical pollution will… • Financial capital? Waay out speculations… (that whole sustainability literature!) – Positive discount rate: no help with far term.
What a mess! Work back? • Some relief if we work backwards? • Far term: No regrets defense of the core! • For Natural capital? Four goals: • Traditional conservation of biodiversity • Connectivity conservation for restoration • Adaptation capacity conservation • And, soil capacity conservation: Good topsoil is the closest thing to a free lunch (but we have to redefine the opportunity cost!) • NEED PROTECT THESE NOW, BONUS: less cumulative impact mess? (ESA, TMDL)
Human: services, TEK/LEK/Craft Social: rural viability service thresholds, QOL, tax base and govt. capacity, lack of alternative economy Built: Water distrib, town infrastr., housing Financial: draining Natural: severe soil, habitat issues, RRD Keep farmers working, grow new ones Keep towns functioning conservation upgrade, AMENITY and QOL values NEW idea Financial: Revolving Fund (CW, DW) model TECHNICAL ASSIST and urban relocates Natural: avoid revege-tation nightmare/cost! 5 Capitals: Near term
Human: New farming and new markets Social: Limit consolida-tion, go to QOL base Built: Transportation (RR due back now!) and local people transit Financial: Urban pool and economies of scale partnerships Natural: Soil focus, new $ from conserved area $ from Water into re-capitalize with LT Plans “Right-sizing”, flexibility Transport and tax base stability to keep service level goals (medical…) Govt role unavoidable and long overdue Partnership Purchasing Districts, Insurance, etc Buy those beneficial externalities! 5 Capitals – Mid Term
Ownership and Resource Management Organization • Fragmentation is for football/volleyball etc, not for unequal access to planning and management capacity, etc etc etc... • Forget defending the status quo – tried it • Municipal “permanence” in water supply matches to rural long-term management of long-term core resources – after that, the rest is managing agency problems…
A drainage ditch near Ordway, CO, after the wind erosion after the fire after the wet spring and winter after an average year after the multi-year drought after years of water erosion on the formerly irrigated lands after farming from 1860s -70s until the 1960s… When the water was sold and there was no idea of revegetation… We’re riding a tiger… in the dark Pueblo Chieftain Photo, Chris Mclean, 02 May 08
Phew! Thank you! • More information and opinion available from <John.Wiener@Colorado.Edu> • Hand-outs on water transfer forms for Colorado; general applicability • All comment/criticism welcome • Near term goal: get some of this into the policy discussions, but can’t rush it with Committee coming out soon… so time to work quietly on this