Download
1 / 42
420 likes | 699 Vues
Hazardous Road Locations. Hossein Naraghi CE 590 Special Topics Safety February 2003. Time Spent: 14 hrs. Hazardous Road Locations.

E N D
Hazardous Road Locations Hossein Naraghi CE 590 Special Topics Safety February 2003 Time Spent: 14 hrs
Hazardous Road Locations • Hazardous road location (HRL) program is a formal process to identify locations which have an unacceptably high crashes, in order to develop appropriate treatments to reduce the number or severity of crashes. • Few treatments will reduce both • Most reduce only one or the other • Either outcome is a benefit, since both will reduce the cost of crashes
Crash data aggregation • Crash histories need to be aggregated in order to have some confidence in the beneficial effects of the remedial measures • Appropriate aggregation include • Crashes clustered at intersections or on short lengths of a road • Hazardous sites or ‘black spots’ • Crashes clustered along routes or section of routes • Hazardous routes • Crashes clustered within an area • Hazardous area • Groups of crashes for which there are known effective treatments, occurring across several sites
Crash data aggregation (continued) • Groups of crashes of a similar type, occurring across several sites • A series of crashes that have common features • Road features • Bridges • Vehicle features • Bicycles • Road user features • Pedestrians • Contributory features • driver fatigue • A series of high profile crashes • Crashes involving vehicles carrying dangerous good • Crashes at railway crossing
Engineering remedies • There are some mass action programs which apply known engineering remedies across a range of affected HRL sites • Examples • Running off the road crashes • Remedial program • Shoulder sealing • Treatment of dangerous curves • Treatment of fixed roadside hazards
Engineering remedies (continued) • Crashes at signalized intersections • Remedial program • Installation of fully controlled turn phases • Installation of red light cameras • Replacement of signalized intersections with roundabouts • Overtaking crashes on 2-lane rural highways • Remedial treatment • Provision of overtaking lanes • Wet weather crashes • Remedial treatment • Provision of skid resistant pavements
Objectives of HRL programs • The overall goal of HRL program • Identify locations which have both high risk of crash losses and economically justifiable opportunity for reducing the risk • Identify countermeasure options and priorities which maximize the economic benefits
Objectives of HRL programs (continued) • To achieve HRL program goal, specific targets should be set • The Institution of Highways and Transportation suggested the following objectives • Single site • Achieve 33% of average crash reduction • Achieve 50% first year rate of return • Route action • Achieve 15% average crash reduction • Achieve 40% first year rate of return
Objectives of HRL programs (continued) • Area action • Achieve 10% average crash reduction • Achieve 10-25% first year rate of return • Mass action • Achieve 15% average crash reduction • Achieve 40% first year rate of return • Higher rate of return expected from single site actions,with lower rates as the focus of action becomes more diffuse. • Although economic criterion was a useful practical objective, plans should finally be evaluated more thoroughly by looking at the discounted value of the full time stream of the benefits rather than the first year benefits only
Identification of hazardous road locations • In order to identify a hazardous road location, it is necessary • To define the site, route or area • To have explicit criteria • The criteria will require the use of measure of exposure to risk • To take account of crash severity • To consider the time period for the analysis
Sites, routes and areas • Hazardous site analysis involves an examination of crash patterns at a specific location such as • An intersection • A short length of road (e.g. a bend) • A specific road feature ( e.g. a bridge) For the purpose of analysis it is necessary to define the road length, or in the case of intersections, to be specific about the definition
Sites, routes and areas (continued) • Intersections are usually defined as the area bounded by the projections of the property boundaries, plus a certain distance (typically between 30-100 feet) of the approach road. Crashes occurring within this area are classified as intersection crashes and all others are link or ‘mid-block’ crashes
Sites, routes and areas (continued) • By definition routes are longer than sub-division of roads, typically from about 0.6 to 6 miles • An area needs to be reasonably homogeneous in its characteristics, such as land use, density, street configuration, typically an area is 2 square miles or larger
Criteria • A number of criteria used to identify hazardous sites and routes • Number of crashes per unit length of road in a given period exceeding some set level (e.g. 3 per year). No account of exposure • The rate of crashes for a given period exceeding some set value (e.g. 5 crashes per million vehicle miles) • The number and rate of crashes both exceeding some set levels
Criteria (continued) • Rate quality control (RQC) method • Determines if the crash rate at a site is significantly higher than a predetermined rate for locations of similar characteristics base on Poisson distribution • Potential crash reduction (PCR) method • This is the difference between observed and expected crash experience calculated from the site and traffic flow characteristics from selected sites which will maximize the crash reduction if their crash history can be reduced to the expected value This is essentially RQC method using frequencies not rates
Criteria (continued) • Rating by crash severity method • In this approach past crashes are weighted according to their severity to produce an index, the index then being used as selection criteria • Hazard index method • In this approach number of factors such as rates, frequencies, severities, and probably site data such as traffic flow and sight distance. A weighted average of this factors is then calculated to create a composite index
Criteria (continued) • Rating not according to crash history, but by site features • These include • road features (curves, grades) • Roadside features • Traffic features a weighted sum of the value of each of these features is calculated to determine priority for site treatment • The current annual cost of crashes based on average cost of crash by accident type • This takes account of different severities, in a way that relates directly to evaluation without having to take resources in arbitrary weights
Criteria (continued) • A number of criteria used to identify hazardous areas • Number of crashes per square mile • This does not take to account the variation in the length of road and traffic flow • Number of crashes per head of population • Number of crashes per mile of road • Takes no account of traffic flow • Number of crashes per vehicle owned or available to population • This takes account of traffic flow • The annual cost of crashes occurring within the area
Criteria (continued) • There is a little consensus on which criteria (sites, routes or areas) are most appropriate • Those criteria which combined both frequency and rate have some attraction since they lead to identification of sites which have a high risk (in terms of crashes per unit of exposure) and relatively large number of crashes • The key issue is how the criteria adopted direct the analyst to consider sites which contributes to the overall road safety goal, namely the maximization of benefits of road safety treatments
Criteria (case study) • To examine how the criteria adopted will direct analyst to find the candidate sites for treatments a sample of 198 intersections n Adelaide, Australia tested by Sanderson and Cameron (1986). They determined • Casualty crash frequency is an adequate basis for identification of HRL, but economic benefits maximized when sites are identified on the basis thattheir casualty crash rate is significantly greater than the system average casualty crash rate for that intersection type • A combination method based on ranking by casualty crash rate an casualty crash frequency is almost as good
Criteria conclusion • Based on different studies, it was concluded that use of either the potential crash reduction (PCR) method or the rate quality control (RQC) method • Maher and Mountain (1988), while acknowledging the theoretical superiority of the PCR method, claim that it is not necessarily perform better than the method based simply on crash frequency because of ‘inaccuracy of the estimation of the expected crash frequency at a site required in PCR’ This is because the PCR method should make a correction for the ‘regression to mean’ effect
Method usage • All of the mentioned methods are in use either alone or in combination • In US • Crash frequency used by 89% of agencies on major roads and 73% on minor roads • Crash rate or RQC used by 84% of agencies for major roads and 50% for minor roads • Crash severities used by 65% of agencies for major roads and 45% for minor roads • In UK • 74% used crash frequency • 6% used crash frequency weighted by severity • 4% used crash rate • 13% used multi-factor approach • 11% used a subjective method • 6% used other methods
Method usage (continued) • In Australia • In a survey of method used in Australia by Ogden 1994, it was found that • Crash frequency was most widely used for identification of hazardous intersections • Potential crash reduction (PCR) method were in wide use for hazardous routes identification • Cost criterion was used by some jurisdictions to identify sites or routes which will maximize the economic benefits after treatments
Exposure measures • One of the major theoretical and practical problems facing safety analysts is accounting for exposure to risk of a road traffic crash • For HRL analysis, a measure of exposure may be used directly, or a proxy measure in terms of an index may be used • The typical measure is the total traffic flow expressed as (AADT) • The crash rate express as annual crashes per vehicle miles (AADTx365xlength of the section), usually expressed as crashes per 10^8 VMT
Exposure measures (continued) • Traffic flow is a crude measure of exposure because different crash types relate to flow in different ways • Single vehicle crashes may be expected to be somewhat proportional to traffic flow • Head-on crashes may be expected to be proportional to the power of traffic flow • Number of studies concluded that crashes on links are not linearly related to traffic flow • Single vehicle crash rate per VMT decreases with increasing flow rate • Multi-vehicle crash rate per VMT increases with increasing flow rate
Unsignalized intersections or nodes • For unsignalized intersections, safety relates to the number of gaps in the opposing traffic flow and the success of driver in finding those gaps • Various studies attempted to relate crashes to measures of traffic entering the intersection • Sum of entering flows (Sanderson and Cameron 1986) • Product of conflicting flows (Tanner 1953) • Geometric mean of the average entering flows (Chapman 1973) • Square root of the product of conflicting flows (Tanner 1953, Bennett 1966) • Square root [(V1+V3)/2]x[(V2+V4)/2] Where V1…V4 are the entering flows sequentially around the legs of an 4-leg intersection
Unsignalized intersections or nodes (continued) • Several statistically significant models relating crashes to traffic flow were developed, but it was found that crashes were more closely related to a root of the product of conflicting flows than to the product or sum of the conflicting flows • Tending to confirm Tanner’s earlier square root law, Maycock and Hall 1984 developed equation for 4-arm roundabouts A=kQ^a Where k and a are constants for a given crash type and Q is entering flow, e.g.
Unsignalized intersections or nodes (continued) • For entering-circulating crash • A=0.52 and k=0.090 (small roundabouts) or 0.017 (conventional roundabouts) • For crashes on approach to the roundabouts • A=1.58 and k=0.0025 (small) or 0.0055 (conventional) • For single vehicle crashes • A=1.20 and k=0.0068 (small) or 0.0164 (conventional)
Unsignalized intersections or nodes (continued) • For rural T-junction A=0.24(QP)^0.49 where: A=#of crashes occurring within 66 ft of the intersection Q and P=traffic flows on the major and minor legs of the intersection, measured in thousands of veh/d
Signalized intersections • The concept of exposure and relating crashes is much more difficult for signalized intersections • Some crash types such as rear end crashes exhibits the same number of opportunities as if signals were not a feature • The existence of signals alerts the likelihood of certain other crash occurring • Number of empirical studies relating crashes to traffic flow at signalized intersections
Signalized intersections (continued) • The most comprehensive undertaken at University of North Carolina for FHWA • The outcome was a series of empirically-derived regression equation expressing exposure for several specific crash types (e.g. head-on, rear-end, sideswipe) and intersection characteristics (unprotected, fully controlled or partially controlled turns) The independent variables in these equations were intersection width, cycle length, number of lanes, traffic flows and green splits
Signalized intersections (continued) • Another study by Hauer, Ng and Lovell (1988) undertaken in Toronto • They build several models relating the number of the crashes at intersection to the relevant measure of traffic flow. • On this basis were able to estimate the number and type of crashes that could be expected at any given intersection. • Comparing this with the actual crash experience at that site enabled sites to be identified • This model also depends mainly on the availability of traffic flow data including turning volumes and intersection crash data
Signalized intersections (continued) • A less data intensive model was developed by Hall (1986): A=0.023QT^1.28(1+PT^0.30) A=# of reported crashes QT=total vehicle inflow (sum of entering vehicles) PT=total pedestrian flows (sum of entering pedestrians)
Severity • Severity classification may be used to identify sites with high number or high rate of serious crashes • One way of doing this is to give each crash a weight representing the average cost of crash in the severity category in which it falls • This leads to fatal crash typically having 10 times the weight attached to injury crashes • Fatal crashes often dominate the identification procedure, but the circumstance which lead to fatal crashes may be very similar to those which produces injury crashes,the severity outcomes being a matter of chance
Time period • In any study of crashes, a basic question which needs to be addressed relates to the time period of analysis • How much historical crash data should be used to assess the location • Various factors that might affect the choice of time period • Avoid having environmental (e.g. traffic growth) and other trends affecting results • Use annual crash data count to avoid the effects of seasonal variation in crash occurrence • Computer storage and processing cost • Changes in database definitions introducing discontinuities in the data
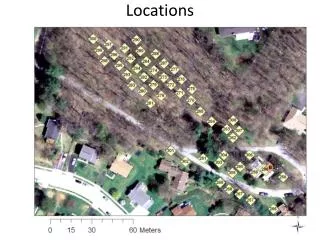
Clustering of crashes • Crashes are over-represented at specific sites • The objective is to identify the clustering sites and develop a program to treat high crash frequency sites • Cluster analysis • The cumulative percentage of crashes plotted against the cumulative percentage of sites (e.g. intersections) Cumulative percentage of crashes = #of crashes per site x #of sites
Clustering of crashes (continued) • See figure 5.1 page 114 • From the figure 50% of crashes at intersections occurred at about 23% of the sites. In average 2.4 crashes occurred at these intersections • It is very important to identify the clustering sites • When a few sites account for a large proportion of the crashes, improvements at these sites will most probably give overall reduction in crashes
Chance variation • Identifying HRL involves analysis of data • The results of data analysis can be subjected to statistical analysis in order to distinguish between significant factors and those occurring through chance variation • It is important to find out that an abnormal number of crashes in a time period should be taken as evidence that the site is hazardous or if the fluctuation can be taken as mere chance variation
Chance variation (continued) • If we assume that the number of crashes at a site varies randomly from year to year, we might use the Poisson distribution P(x)=[(m^x)(e^-m)]/X! P(x)=probability of x occurrences of an event for which the expected number of occurrence is m • This is an important test to use when deciding whether to designate a site as beneficial for further investigation, as it will give an indication that the high crash occurrence is due to a random variation
Applications of HRL criteria • Four stages have been used in identification phase of HRL process • Search the data bank for initial identification of crash locations • Apply statistical and numerical techniques to produce a preliminary ranking of sites for further study • Verify crash locations with reference to the original police crash report form if necessary, to carry out a preliminary study of crash data • Carry out preliminary on-site observation to relate the crash study to site features and condition of the traffic
Applications of HRL criteria (continued) • The stages to identify HRL IS A reminder that HRL exercise is a process which is ongoing and inter-related • The output so far is a list of candidate sites (sites, which are potential candidates for being selected for remedial treatments • A sudden unexpected increase in crashes at a site, political pressure to do something at a site or media attention to a particular crash • Resources are limited, it is important that the process concentrates on sites with with the greatest potential for cost-effective treatment • The process is as much about exclusion of sites from consideration as it is about inclusion
Applications of HRL criteria (continued) • Having determined, on an ongoing basis, which sites are hazardous • Next stage involves identifying whether a crash pattern at a site is amenable to treat with road and traffic engineering remedial measures • This leads us to consideration of the diagnosis of crash problems