Download
1 / 24
240 likes | 398 Vues
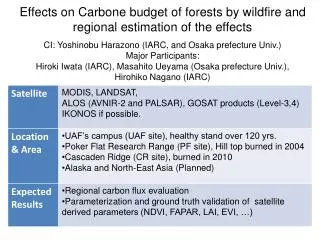
Development of coupled ice-ocean ecosystem and application to the ice-core data in land fast ice offshore Barrow. Meibing Jin, Clara Deal, Jia Wang (IARC) K-H Shin (IARC, Korea) Nori Tanaka (IARC, JAMSTEC) T. Whitledge, S-H Lee, and R Gradinger (IMS)

E N D
Development of coupled ice-ocean ecosystem and application to the ice-core data in land fast ice offshore Barrow Meibing Jin, Clara Deal, Jia Wang (IARC) K-H Shin (IARC, Korea) Nori Tanaka (IARC, JAMSTEC) T. Whitledge, S-H Lee, and R Gradinger (IMS) Arctic Modeling Group, International Arctic Research Center, University of Alaska Fairbanks, Hanyang University, Ansan 426-793, Republic of Korea Institute of Marine Science, University of Alaska Fairbanks IORGC, JAMSTEC, Yokosuka, 237-0001, Japan
Outline • Introduction • Ice core observations off Barrow in 2002 & 2003 • Description of IARC PhEcoM and ice algae model • Simulation of ice algae bloom in 2002 and 2003 • Ice algal primary production and export to the benthos • Conclusions and future efforts
Introduction and MotivationThe controls of the sea ice ecosystem are still poorly understood compared to those of the water column ecosystem due to sparse observations and complexities.
Ice ecosystem models have been applied to very few sea ice habitats • Fast ice ecosystem of McMurdo Sound, Antarctica, by Arrigo et al. (1993) and Arrigo and Sullivan (1994). • Ice-covered ecosystem of Lake Saroma, by Nishi and Tabeta (2005) . • Carbon flows through the microbial food web of first-year ice in Resolute Passage (Canadian High Arctic) were inferred using an inverse model by Vezina et al. (1997). • Coupled snow-ice-ice algae model in Resolute Passage (Canadian High Arctic) by Lavoie et al. (2005)
2. Ice core observation offshore Barrow • The ice algal community of the Alaskan Chukchi Sea was first observed in 1972 and 1973 (Alexander et al., 1974). • A series of ice core observations was made approximately 1km offshore Barrow by IARC and IMS scientists, in spring (March to June) of 2002 and 2003.
Locations of the ice-core samplingsin the spring of 2002 and 2003 GI and APL IMS IARC
Left: observed ice thickness at IARC site, snow and ice thickness at Gi site, 2002Right: observed ice thickness at IARC site, snow and ice thickness at APL site, 2003
Left: observed ice temperature Right: observed ice algae in sea ice at IARC site, 2002
Left: temperature in sea ice and waterRight: salinity in sea ice and water at IARC site, 2003
3. IARC Physical-Ecosystem Model (PhEcoM) and ice ecosystem model • 9-compartment PhEcoM coupled with 3-D POM (Wang et al. 2003, user’s guide); applications to Bering Sea with 1-D version (2.5 closure turb. model and tidal mixing): Jin et al (2006, JGR, in press) Deal et al. (Prog. Oceanogr., submitted) • 4-compartment ice algae model, application to Chukchi Sea (Barrow, Alaska) (Jin et al., 2006, Annals of Glaciology, in press)
3.1 The PhEcoM and ice algae model Flowchart of the biological components 4-compart. ice algae model Jin et al. (Annals of Glaciology, in press) 9-compart. coupled Physical-Ecosystem Model (PhEcoM) Wang et al. (2003) Jin et al. (JGR, in press) Deal et al. (Progress In Oceanography, submitted)
3.2 IARC Physical-Ecosystem Model (PhEcoM) The biological model is adapted from Eslinger et al (2001b), Wang et al. (2003), with 9 compartments: two phytoplankton (diatom and flagellates: D and F), three zooplankton (small copepods, large copepods, and other large zooplankton: ZS, ZL, ZP), three nutrients (nitrogen, ammonium, silicon: NO3, NH4, Si) and detritus (Det). The vertical mixing coefficient KH is calculated by 2.5 closure turbulent model and used in all the biological equations as follows:
3.3 The ice-ocean ecosystem Model Ice algal ecosystem model equations: Ice Algae Nitrate-nitrite Ammonium Silicon The water-ice interface transport Twi is calculated using the relationship during ice formation: and during ice melting:
4.1 Simulation of ice algae bloom in 2002 (b) sensitivity studies case 1: doubling initial Ai=> early bloom and last by a week (a) standard run
4.1 Simulation of ice algae bloom in 2002, continued (c) sensitivity study case 2: doubling light=> early bloom, and higher amplitude (d) sensitivity study case 3: doubling initial nutrients concentration=> early bloom & doubling the peak
4.1 Simulation of ice algae bloom in 2002, continued (e) sensitivity study case 4: unadjusting water ice transport => melting season extended (f) sensitivity study case 5: diatom grows as ice algae => less algae bloom, because diatom takes more nutrients
4.2 Simulation of Phytoplankton in 2002 (b) case 5: diatom grows as ice algae => both algae and water phytoplankton (diatom) that grows in low light conditions (a) standard run and sensitivity study => only ice algae
4.3 Simulation of ice algae bloom in 2003 (b) sensivity study case 6: adjusting snow depth to zero from April 1 to 27 and adding 25cm of snow depth from April 28 to May 17. (a) standard run
4.4 Simulation of Phytoplankton in 2003 (b) sensivity study case 6: adjusting snow depth to zero from April 1 to 27 and adding 25cm of snow depth from April 28 to May 17. (a) standard run
5. Ice algal primary production and export to the benthos (Previous estimates of primary production with in situ data in the nearby Alaskan Arctic range from 1 to 5 g C m-2)
6. Conclusions • we propose a three-stage ice algal bloom with different dominant controls at each stage: • onset and early slow growth stage before middle March, when growth is limited by day length and light intensity; • fast growth stage in April with increasing light intensity until nutrients exhausted; • dramatic decline stage after late May as ice algae are flushed out of the ice bottom and ice algal growth are limited by nutrients. • Stages 2 and 3 are either separated by a transition period when nutrients are exhausted before ice melting, or directly connected by ice melting.
6. Conclusions, continued The sensitivity studies showed that environmental changes that alter nutrient concentrations or change the light regime, such as changes in river discharge, snow cover and sea ice extent, have different influences on the marine ecosystem. These influences may cascade through the marine ecosystem to affect the food web and hence biogeochemical cycling in the Arctic. An unexpected “phytoplankton bloom” under the ice in 2002 calls for more observations to investigate the underlying mechanisms, either by local growth or advection from leads further offshore.
Future Efforts Couple 3-D PhEcoM with ice algae community to IARC Coupled Ice-Ocean Model (CIOM) in the Bering Sea and Beaufort and Chukchi Seas