Download
1 / 36
360 likes | 641 Vues
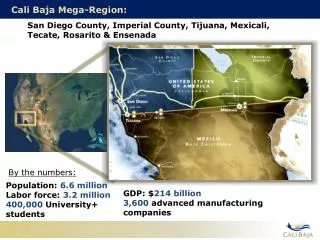
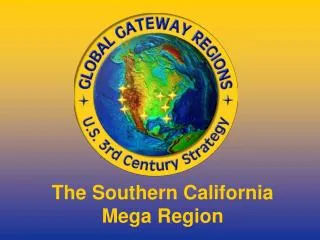
The Southern California Mega Region. Being Competitive Participants in the Global Economy. Southern California. Southern California. Southern California. SOUTHERN CALIFORNIA MEGA-REGION. 1.5% of U.S. land area (53,000 sq.mi.) Over 7% of U.S. population (22 million)

E N D
SOUTHERN CALIFORNIA MEGA-REGION • 1.5% of U.S. land area (53,000 sq.mi.) • Over 7% of U.S. population (22 million) • 58% of California annual GDP ($900 billion) • The WORLD’S 10th LARGEST ECONOMY
Southern California SOUTHERN CALIFORNIA GLOBAL GATEWAY TRENDS
35% Increase from 2000 POPULATION GROWTH Population is expected to grow to 27,700,000 by 2030
TRADE GROWTH Los Angeles/Long Beach port complex 5th largest in world 44 million 20 ft. containers by 2030 - reaching capacity
GROWTH IN AIRPORT DEMAND • Mega-region’s airports make So. Cal the busiest of all regions in the country • 94 million passengers served in 2003 • Demand forecast to double before 2030 • Cargo expected to triple
Southern California The region accomodates nearly 30% of the nation’s waterborne trade, and 60% of total cargo containers. Although this activity greatly benefits the nation as a whole, the region incurs a disproportionate share of the burden in congestion and air quality costs.
Projected Growth 80% 70% 60% 50% 40% 30% 20% 10% 2000 2010 2020 2025 Worst in nation since 1982 HIGHWAY CONGESTION truck travel auto travel population
AIR POLLUTION • Progress has stalled and diesel emissions from ships, locomotives and port complex are projected to increase • Mega-region continues to have the worst air quality in the U.S.
THREATENED ENVIRONMENT & QUALITY OF LIFE ENERGY Demands on the capacity and distributionof energy will remain a major challenge WATER Per capita demand not projected to decline as the population increases HABITAT & OPEN SPACE Suburban-style sprawl continues to consume native habitat
Southern California 2/3 of region is government-owned and off-limits to development Dense development pattern: 15,000 to 20,000 people/sq.mi.
#1 #9 Highest percentage of owner and rental households spending30% or more on housing Percentage of adults who have attained at least a high school diploma #1 Highest rate of crowded housing GROWING ECONOMIC &SOCIAL DISPARITY Among Nine Largest Metro Regions
Southern California Improving the region’s jobs-housing balance is the most critical short-term goal to avoid a complete collapse of the transportation, housing and social networks in place.
Southern California SOUTHERN CALIFORNIA GLOBAL GATEWAY STRATEGIES
Reinvest and redevelop alongexisting and planned transportation corridors and in regional centers
Mobility Sustainability Livability Prosperity Preferred Alternative • Distributes regional employment & housing growth following 4 guiding principles • Focuses growth along existing & planned transportation corridors and in existing and emerging centers • Will guide SCAG’s regional programs & policies
Household Growth 2010-2030 (without Growth Vision)
Household Growth 2010-2030 (with Growth Vision)
Changes will affect only 2% of regional land mass Project Vision
Support Industry Sectors providing good-payingjobs to a less educatedlaborforce Tech Dependent On the Job Learning Defined Skill Ladder Good Entry Level Pay Blue Collar Southern California Based LOGISTICS
Logistics Jobs In 2003 Wholesale Trade Truck Transportation Transportation Support Couriers General Warehousing Air Transportation Rail Transportation Water Transportation 352,373 54,504 52,662 30,090 28,442 25,466 2,952 1,789 548,278 Total Source: Quarterly Census of Employment Wages, CA EDD, 2004
16% 1 out of 12 jobs in 2003 14% 14.9 14.1 12% 12.1 10% 10.6 8% 9.6 8.1 6% 7.5 4% 4.8 2% 3.5 1.7 0% Educ. & Health Services Constr. Logis-tics Prof. & Bus. Services Manf. Gov’t. Financial Activities Motion Picture Leisure andHosp. Other Services Share of Mega-Region Jobs % SCAG Jobs
1 of highest paying $1600 $1400 $1353 $1200 $1194 $1000 $800 $847 $843 $811 $777 $600 $718 $400 $413 $400 $200 0$ Educ. & Health Services Constr. Prof. & Bus. Services Manf. Logistics Gov’t. Financial Activities Motion Picture Leisure and Hospitality Other Services Compared to other Sectors $ Weekly Pay Average weekly pay for all industries is $749 $866
Make transportation infrastructure investments to support growth of trade and jobsand reduce congestion
Total LA/Long Beach Container GrowthProjected to Triple in 25 Years 44.7 36.0 18.3 13.2 In Million TEU’s (20’ Equivalent Units) Source: POLA, POLB 2005 2010 2020 2030
Diesel Particulates They comprise 71% of the major pollutants contributing to cancer risk in the South Coast Air Basin Source: SCAQMD, Multiple Air Toxics Exposure Study II, March 2000
5,400 Premature Deaths Annually 140,000 Children Have Asthma 980,000 Lost Work Days 2,400 Hospitalizations
75% - 80% of the emissions come from mobile sources outside of local control
Proposed High-Speed System Initial Operating Segment81 miles6 stations$11 billion capital cost$110 million annual O&M ELECTRIFIED Freight System90 miles6 stations$19 billion capital cost$296 million annual O&M4 to 13 million TEUs
New Rail Capacity & Improvements ELECTRIFIED East-West Corridor Colton Hobart Alameda Corridor More tracks, alternative routes, grade crossings
GLOBAL GATEWAY THINKING • Promotes relationships between existing metropolitan areas • Supports sustainability and long-term vitality • Streamlines transportation and land use patterns • Fosters better economies • Encourages cost-saving measures through cooperation