Download
1 / 20
210 likes | 481 Vues
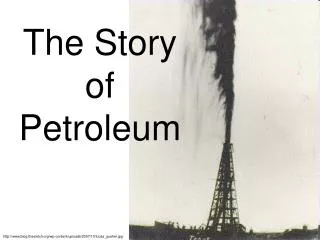
Organization of the Petroleum Exporting Countries. OPEC’s perspective on oil market developments . Dr Adnan Shihab-Eldin Acting for the Secretary General. 7 th APEC Energy Ministers’ Meeting 19 October 2005 Gyeongju, Republic of Korea. World economic growth & APEC economies.

E N D
Organization of the Petroleum Exporting Countries OPEC’s perspective on oil market developments Dr Adnan Shihab-Eldin Acting for the Secretary General 7th APEC Energy Ministers’ Meeting 19 October 2005 Gyeongju, Republic of Korea
World economic growth & APEC economies • Strong growth in APEC economies (e.g, China): growing faster than the world with significant contribution to the global GDP • Globalization process (export-led growth, increasing role of FDI) • As the most economically dynamic region in the world, the Asia-Pacific now accounts ~ 60% of global energy demand. • The first 3 largest oil consumers are within APEC
Non-OPEC supplyyear-on-year change, mb/d • While growth in non-OPEC supply up to 2003 were exceeding that of demand, since then had been significantly below demand growth • However, Non-OPEC supply in 2005 has been affected by unplanned shut-downs & a lower rate of growth from Russia • Gradual recovery & growth in West Africa, Brazil, Canada & FSU
OPEC response: higher production leading to significant stock build up
50 50 48 48 46 46 44 44 42 42 40 40 38 38 36 36 34 34 32 32 30 30 28 28 26 26 2004 2005 2006 2007 2008 2009 2010 OPEC NGL High High (in NGL) Accelerated OPEC capacity expansion plans
Investment needs in the refinery sector: 2005 - 2015 Investment needs in the refinery sector: 2005 - 2015 Condensate Splitter Unit Expansion Condensate Splitter Unit Expansion Refinery Expansion by Refinery Expansion by by OPEC Member Countries by OPEC Member Countries OPEC Member Countries OPEC Member Countries 3,838 3,838 (up to 2010) (up to 2010) 578 578 900 900 146 146 806 806 4000 4000 800 800 1,860 1,860 Construction Construction 3500 3500 660 660 Construction Construction 700 700 3000 3000 600 600 2500 2500 Planning Planning 500 500 2000 2000 Total Total 400 400 Total Total 1,400 1,400 Planning Planning 1500 1500 300 300 1000 1000 200 200 Under Under Consideration Consideration 100 100 500 500 0 0 0 0 Downstream challenges • OPEC is attending to rising product demand both domestic & Asia-pacific region, as well as to meet higher product specifications • Pursue global downstream investments, particularly in Asia-pacific region • By implementing of these plans, they would be able to install over 4.6 mb/d new capacity (i.e. about 3.8 mb/d refinery capacity and 800,000 b/d condensate splitter). • Major part of these new capacities will be invested by Saudi Arabia and Kuwait. Similarly most of these projects would be either in the Middle East or in Asia.
Gains from US gasoline price rises The Washington Post issue of 25 September 2005 calculated that, in the USA, when the average price of a gallon of regular gasoline peaked at $3.07 recently, the nation’s refiners were getting more than three times the amount they earned the year before, when the same gasoline sold for $1.87. However, the companies that pumped oil from the ground gained only 46 %.
Increasing activity in the Futures market • Growing use of oil futures as a form of financial instrument • NYMEX hit a record high in 2005 surpassing the record in 2004.The average volume of contracts rose in 2005 to 237 million contracts compared to 179 million contracts in 2003 • OPEN interest also shows a higher record in 2005 of 792 million contracts compared to 542 million contracts in 2003
The price of oil: distinguishing between nominal and real, (US$/b) • Although reaching historical highs in nominal terms, the real value are still well below levels reached in early 1980s. APEC • Steady decline in oil intensities! APEC
OPEC Long-Term Strategy 1/2 • The strategy recognises important role of oil: • in world economy • for socio-economic development of OPEC Member Countries • It defines specific objectives, identifies key challenges and explores scenarios for energy scene • It is designed to be robust and adaptive • It provides coherent and consistent vision and framework for OPEC’s future
OPEC Long-Term Strategy 2/2 • Objectives relate to: • long-term petroleum revenues of Member Countries • fair and stable prices • role of oil in meeting future energy demand • stability of oil market • security of regular supplies to consumers • security of oil demand • legitimate interests of Member Countries in multilateral agreements • The identified key challenges concern: • uncertainties surrounding future oil demand (world economy, consuming countries’ policies, technological developments, etc.) • supply side, taking into account: resources, potential non-OPEC production, extent and timing of required investment, together with associated uncertainties
Reference 2010 2015 2020 2025 OECD 51.4 52.7 53.8 54.7 DCs 34.4 40.3 46.4 52.8 Transition economies 5.1 5.4 5.7 5.9 Total World 90.9 98.4 105.9 113.4 Tight market scenario 93.1 101.9 111.2 111.2 Soft market scenario 89.2 94.4 99.0 99.0 Oil Demand Outlook, mb/d “Four-fifths of the increase in demand of 30 mb/d over the period 2005–2025 comes from developing countries Transportation continues to be the dominant source of growth (~60 %) Many uncertainties: GDP, technology, policy – substantial downside risks
Reference 2005 2010 2020 2025 OECD 20.9 20.9 19.9 19.3 DCs excl. OPEC 16.1 18.2 19.4 18.9 Russia & Caspian 11.7 13.1 14.9 15.3 Non - OPEC 50.5 54.3 56.8 56.4 OPEC (incl. NGLs) 33.1 36.6 49.1 57.0 World 83.6 90.9 105.9 113.4 40 40 46 50 OPEC % M arket S hare OPEC (incl. NGLs) 33. 7 40.4 53.9 53.9 Tight market scenario 3 2.6 3 2.7 4 4 2.6 2.6 Soft market scenario Oil production outlook,mb/d Key sources of non-OPEC increase: Latin America, Africa, Russia and Caspian OPEC increasingly supplies incremental barrel Significant medium- to long-term uncertainties
Oil Resources Oil Resources Proven Crude Crude Oil Proven Gas Gas Marketed Oil Reserves Production Reserves Production Source : OPEC 100 21.3 90 51.0 80 15.0 58.5 70 83.0 60 c 63.7 9.8 50 h 12.4 40 39.2 30 29.1 20 7.8 9.2 10 Source : OPEC 0 Proven Crude Crude Oil Proven Gas Gas Marketed OPEC Middle East OPEC Rest Non-OPEC Oil Reserves Production Reserves Production Oil resources and availability • Proven reserves 891 billion barrels 78% of world figure • Production > 30 million barrels a day ~ 40% of world figure • Exports > 21 million barrels a day ~50% of world figure • Cheaper to exploit than non-OPEC oil • Increasing call on OPEC oil in coming years • >50% world oil market projected for 2025
Dialogue and cooperation • Continued cooperation & genuine dialogue: underlying consensus on handling major issues of mutual concern for the benefit of all. International Energy Forum; International Energy Agency; APEC; EU-OPEC Energy Dialogue; Euro-Mediterranean Dialogue; EU-Gulf Cooperation Council; Asian Oil and Gas Ministers Round Table; Non-OPEC at OPEC Conferences; OPEC & Non-OPEC experts meetings … • Effective engagement on all interrelated issues • Security of supply and demand • Price stability • Energy policies • Multilateral issues (e.g., Kyoto Protocol, WTO) • Technology (e.g., cleaner oil technologies, CO2 sequestration with EOR) • Shared responsibility