Download
1 / 58
580 likes | 605 Vues
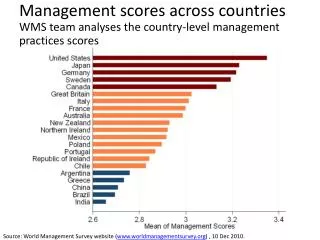
This paper explores firm organization across countries using a new survey tool to uncover factors influencing decentralization, including competition, trust, and religion. The data collected provides insight into managerial decisions and their implications.

E N D
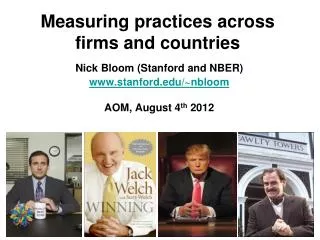
THE ORGANIZATION OF FIRMS ACROSS COUNTRIESJune 2008 Nick Bloom (Stanford, NBER & CEP) Raffaella Sadun (LSE & CEP) John Van Reenen (LSE, NBER & CEP)
THE ORGANIZATION OF FIRMS LINKS TO THREE LITERATURES • Large empirical literature on productivity across firms and countries suggesting firm size & organization matters, e.g. • TFP of IT, eg Gibbons et al (2008), Bresnahan et al (2002) • Growing theory literature on multinationals across countries - e.g. Helpman et al. (2004), Burstein and Monge (2008), Antras et al. (2008) – focused on organization/management. • More generally long literature on the theory and organization of firms but almost no econometric evidence • What exists is typically case-studies, or empirics from a single industry and/or country (e.g. Acemoglu et al. 2007)
IN SUMMARY WHAT WE DO IN THIS PAPER • Collect organizational (& other) data for 4,000 firms in US, Europe & Asia using a new double-blind survey tool (Bloom & Van Reenen, 2007) • Observe significant cross firm and country variation in the organization of firms, particularly in decentralization • Focus on three factors to account for this: • Competition: associated with more decentralization • Trust: associated with more decentralization • Religion: “hierarchical” religions associated with less decentralization • Quantitatively important – these 3 factors account for ≈30% of the cross country variation in decentralization • Note that these relationships may not be causal
Data Collection Methodology • Exploring the raw data • Interpreting the data • Quantification
Central HQ (New York Site) Plant (Phoenix Site) Example A: Domestic Firm 2 Sites, Single Plant D, Decentralization
Central HQ (New York Site) Plant 1 (Detroit Site) Plant 2 (Phoenix Site) Example B: US Domestic Firm Multi-Site, Multi-Plants D3 D1 D2 Plant 3 (Scranton Site)
THE SURVEY METHODOLOGY • 1) Developing organizational questions • Questions on decentralization of: hiring, investment, sales and production decisions from CHQ to plant manager • ≈45 minute phone interview of manufacturing plant managers • 2) Obtaining unbiased comparable responses (“Double-blind”) • Interviewers do not know the company’s performance • Managers are not informed (in advance) they are scored • Run from LSE, with same training and country rotation • 3) Getting firms to participate in the interview • Introduced as “Lean-manufacturing” interview, no financials • Official Endorsement: Bundesbank, Treasury, RBI , etc. • Run by 45 MBA types (loud, assertive & business experience)
SURVEYED ABOUT 4,000 FIRMS • Sampled ‘population’ of medium sized (100 to 5,000 employees) manufacturing firms (median = 270) • Obtained 45% coverage rate from sampling frame • Response rates uncorrelated with performance measures • Adding Brazil, Canada and Ireland this Summer Number of interviews conducted
ALSO COLLECTED HR & “NOISE CONTROL” DATA • Firm demographics, ownership, skills (% college) and other background characteristics • Recorded a series of “Noise controls” to reduce potential survey bias: • Interview: Duration, time of day and day of week • Interviewer: Full set of interviewer fixed effects • Interviewee: Gender, tenure in firm, tenure in post and seniority
Data Collection Methodology • Exploring the raw data • Interpreting the data • Quantification
OUR EMPIRICAL DECENTRALIZATION MEASURE • Main measure averages the z-score (scores normalized to mean 0, standard-deviation 1) of each variable: • Hiring senior employees (discrete, 1 to 5) • Maximum Capital expenditure (continuous, in $) • Introduction of new products (discrete, 1 to 5) • Sales and marketing (discrete, 1 to 5) • Also show results broadly robust to using just the $ investment measure or just the 1 to 5 measures
DECENTRALIZATION VARIES ACROSS COUNTRIES • Most centralized • Asia • Southern Europe • Least centralized • Scandinavian countries • Anglo-Saxon countries Decentralization measure
EXTERNAL VALIDATION (1) • Do these cross-country values look sensible? • Only prior firm decentralization measure to cross-check against we are aware of is from Hofstede (1980) • Surveyed c.100,000 IBM employees across 50 countries during the 1970s & 1980s • Questions on management style (autocractic/paternalistic or consultative) and preferences for delegation • Combined into Power Distance index (1-100), low means limited (preference for) delegation
‘POWER DISTANCE’ SEEMS CORRELATED WITH OUR DECENTRALIZATION MEASURE Decentralization Correlation= 0.80 Power distance
EXTERNAL VALIDATION (2) • There is also a cross-country index of Fiscal Decentralization from Arzaghi and Henderson (2005, JPubE) • Index of Fiscal Decentralization based on 9 factors including: • Government structure (e.g. unitary v federal) • Local (regional/municipal) democratization & autonomy • Local (regional/municipal)control over taxation and spending (education, police, transport etc.) • Surveyed every country with >10 million people (in 1995)
‘FISCAL DECENTRALIZATION’ IS CORRELATED WITH OUR DECENTRALIZATION MEASURE Firm Decentralization Correlation= 0.83 Fiscal Decentralization
DECENTRALIZATION ALSO VARIES ACROSS FIRMS Decentralization measure (higher number is more decentralized)
INTERNAL VALIDATION OF FIRM LEVELS SCORES Correlation between 1st and 2nd interviews (72 firms) correlation 0.51(p-value <0.001) Decentralization – 2nd interview Decentralization – 1st interview
Data Collection Methodology • Exploring the raw data • Interpreting the data • Quantification
BROAD OVERVIEW • Why does average decentralization vary across countries? • Decentralization of decisions within the firm • Other firm characteristics • e.g. size, skills • Industry composition • e.g. larger % of US firms in ‘decentralized’ industries • Regressions condition on covariates in 2 and 3 but “selection” is • interesting in its own right
GENERAL MODELLING FRAMEWORK • Principal-agent • Principal is the Corporate Head Quarters (CHQ) • Agent is the plant manager • Optimal decentralization depends on trade-off between: • Managers typically have better local information than CHQ • Manager’s incentives diverge from firm’s (agency problem) • This can of course be extended in many ways – for example: • Need for coordination • Incentives to communicate (Alonso et al., 2008) • Multi-level agency problems with CEO and owners
COMPETITION AND DECENTRALIZATION • Competition may affect information: • Improves the value of timely responses to local conditions (e.g. Aghion & Tirole, 1997) • But, reduces value of local information as more firms for the principal to learn from (e.g. Acemoglu et al. 2007) • Competition may also affect incentives: • Lower risk of managerabusing autonomy as incentives more aligned with firm (e.g. Schmidt 1997, Vives 2005) • Less incentive to co-ordinate prices • So theoretically ambiguous, but empirically we find strong positive relationship between decentralization and competition
TABLE 2: DECENTRALIZATION AND COMPETITION Notes: Other controls are SIC3 dummies, 12 country dummies, noise controls (interviewer dummies Interviewee tenure and seniority, etc.), public listing, CEO onsite, plant size, Number of competitors (0=none, 1=between 1 and 4, 2=5 or more (as reported by plant manager).
TRUST AND DECENTRALIZATION • Trust may also affect optimal decentralization • Facilitate cooperative solutions in repeated game settings: e.g. Kreps et al. (1982) and Baker, Gibbons and Murphy (1999) • Proxy the congruence of incentives: e.g. Aghion and Tirole (1997) • We find evidence of robust positive relationship between trust in region where plant is located and decentralization
MEASUREMENT AND IDENTIFICATION • Measure trust using the World Value Survey, from the question: “Generally speaking, would you say that most people can be trusted or that you can’t be too careful in dealing with people?” • Trust by region of the country defined as % of people answering “yes” to first part of the trust question • Experimental studies show this question linked with trust/trusting behavior (Glaeser et al, 2000, Sapienza et al, 2007) • Used in prior social capital literature: e.g. Knack & Keefer (1997); Guiso, Sapienza, Zingales (2004);
TABLE 3: TRUST AND DECENTRALIZATION Notes: Other controls are SIC3 dummies, noise Controls (interviewer dummies, Interviewee tenure and seniority, etc.), public Listing, CEO onsite, plant size, regional GDP/head, Regional population, domestic multinational. Weighted by % of WVS respondents in region in country. SE clustered by 112 regions.
USE MULTINATIONALS AS A SECOND TEST FOR IMPORTANCE OF TRUST • Could worry about bias due to trust proxying for other country/regional variables • So look at affiliates of foreign multinationals and investigate whether trust in their home country also matters • Find that characteristics in both region of location and country of origin matter • Parallels literature showing individuals behavior based on origin and location: e.g. Ichino & Maggi (2000), Fernandez & Fogli (2007) and Fisman & Miguel (2008)
Central HQ (New York Site) Plant (Phoenix Site) Example A: Domestic Firm 2 Sites, Single Plant D, Decentralization
Example D Japanese MNE We have affiliates of multinationals if they are under 5000 workers. We Measure D between the domestic CHQ and the plant manager. Test robustness by dropping this firms Global HQ (Tokyo Site) Do not observe D French CHQ (Paris Site) Sweden CHQ (Stockholm Site) Do observe D Do observe D Plant 1 (Lund Site) Plant 2 (Lyon Site)
DECENTRALIZATION AND RELIGION • Religion may affect decentralization via trust • Putnam (1993), La Porta at al (1997), Guiso et al. (2004) argue that hierarchical religions may inhibit formation of horizontal bonds between people, lowering trust • But religion could still play an independent role, as it could reflect preferences for autonomy: • Proxy for regional variations in preference for autonomy • Cause regional variations in preferences for autonomy (e.g. Guiso, Sapienza, Zingales, 2003, on Vatican II)
DECENTRALIZATION AND RELIGION • Measure religion using World Values Survey • Follow La Porta et al. (1997) in defining a “Hierarchical religion” variable which is % people in the region that are Catholic, Orthodox or Muslim • Acceptable restriction from more general model
TABLE 5: DECENTRALIZATION & RELIGION Note: Hierarchical religion is % Catholic, Christian Orthodox or Islam
ROBUSTNESS/EXTENSIONS Firm structure and other characteristics • Single/Multi plant firm • CEO on-site/off-site • Larger firms only • Multinational size control • Management quality Measurement • Components of decentralization question • Worker autonomy Sample and other controls • Sample selection issues: size, industry • OECD/non-OECD • Outsourcing • Nationality of multinational’s managers • Incentive Pay
Data Collection Methodology • Exploring the raw data • Interpreting the data • Quantification
QUANTIFICATION IN TERMS OF CROSS COUNTRY DIFFERENCES (0.106-0.075)/0.106 = 30% of cross country variation accounted for by 3 factors
ACROSS COUNTRIES THE IMPLIED FIT LOOKS REASONABLE, EXCEPT IN JAPAN raw data % “explained” in prior table Decentralization measure
SUMMARY AND NEXT STEPS • New data showing substantial cross-firm and country variation in decentralization • Preliminary results suggests competition, trust and religion can account for about 30% of cross-country variation • Also find multinationals “export” their domestic organizational attributes abroad • Next steps is to look at: • Outsourcing/Industry structure • Firm hierarchy (span of control, etc.) • Worker autonomy
MY FAVOURITE QUOTES: The British Chat-Up [Male manager speaking to an Australian female interviewer] Production Manager: “Your accent is really cute and I love the way you talk. Do you fancy meeting up near the factory?” Interviewer “Sorry, but I’m washing my hair every night for the next month….”
MY FAVOURITE QUOTES: The Indian Chat-Up Production Manager: “Are you a Brahmin?’ Interviewer “Yes, why do you ask?” Production manager “And are you married?” Interviewer “No?” Production manager “Excellent, excellent, my son is looking for a bride and I think you could be perfect. I must contact your parents to discuss this”
MY FAVOURITE QUOTES: Staff retention the American way Production Manager: “I spend most of my time walking around cuddling and encouraging people - my staff tell me that I give great hugs” The difficulties of coding ownership in Europe Production Manager: “We’re owned by the Mafia” Interviewer: “I think that’s the “Other” category……..although I guess I could put you down as an “Italian multinational” ?”
MY FAVOURITE QUOTES: The bizarre Interviewer: “[long silence]……hello, hello….are you still there….hello” Production Manager: “…….I’m sorry, I just got distracted by a submarine surfacing in front of my window” The unbelievable [Male manager speaking to a female interviewer] Production Manager: “I would like you to call me “Daddy” when we talk” [End of interview…]
Example C:US Domestic FirmSingle site, Single plant Central HQ (Phoenix Site) Plant 1 (Phoenix Site) D Drop any firms in which the CEO is the plant manager. Also test robustness to dropping same-site firms.
PAIRWISE CORRELATIONS OF DIFFERENT VARIABLES Notes: p-values in brackets. The variables are residuals from regressions including controls for firm size, plant size, multinational status (domestic/foreign MNE), listed status, CEO on site , noise controls (44 interviewer dummies, day of the week, reliability score, respondent’s seniority and tenure, interview duration