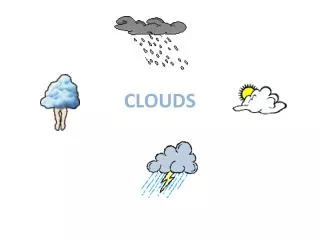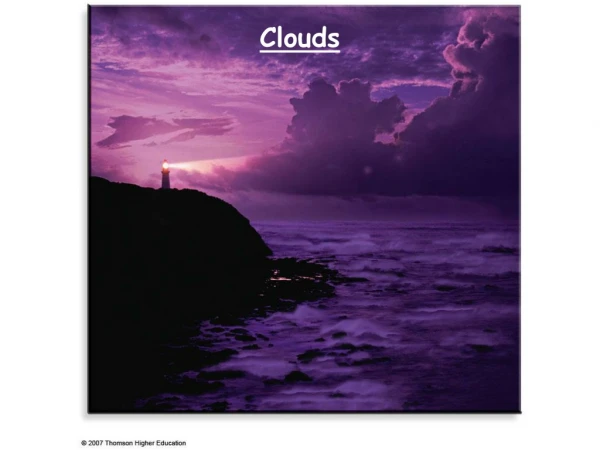
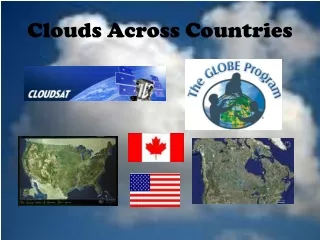
Clouds Across Countries
Students will observe seasonal changes in clouds in different locations and analyze how latitude affects cloud type, duration, frequency, and extent. Protocols will be used for data collection and sharing among sites, with results presented and compared through slides and graphs.

Clouds Across Countries
E N D
Presentation Transcript
Abstract Using CloudSat Data and Protocols, students will observe seasonal changes in clouds in their locations. Their observations will be recorded and their data will be shared among the four sites. From these shared observations, students will analyze the weather data observed at the four different locations to see if the various latitudes have an effect on the type, duration, frequency, and extent of clouds
Introduction, Research Question, & Hypothesis • How does latitude effect the type, duration, frequency, and extent of clouds • Clouds have a direct effect upon global climate change. Latitude is a variable contributing to their formation, duration, and type. The AIM/CloudSat/GLOBE Workshop examined various protocols that teachers would need to know to effectively communicate data collected through their classroom observations that could be used and added to the current data base.
Materials & Methods Materials • Materials being used will be GLOBE Cloud charts • CloudSat data • Google Earth data • GLOBE convex mirrors • Digital cameras • Computers Methods • CloudSat Protocols
Data Summary/Analysis and Results • During the months of September, October, November, and December, students will collect data using CloudSAT and GLOBE protocols. At the end of this period, students will analyze their local results, looking for patterns. • Information will be presented and shared using a single slide-power point format. • Slides will be shared between locations. • Graphs will be generated and then overlaid to show comparisons and contrasts between locations. • Continued observations and data collections will take place from January through May, with a second sharing taking place at the end of May.
Barriers and/or teaching challenges Challenges that the students will be encountering: • The locations of each site. • The location of CloudSat over the various locations when data collections are being made. • Differences in technology among the cooperating schools. • Extreme weather conditions • ESL difficulties • Student technological competencies
Partners • Local weather station personal • Local NOAA representatives • Local Universities, colleges, and other higher education institutes • Regional GLOBE representative • Research institutes
References/Bibliography • http://www.GLOBE.gov • http://CloudSAT.atmos.colostate.edu • http://www.nasa.gov