GIS and Business Tech Workshop: Visualizing Earthquake Data
Engage students in GIS by visualizing and analyzing USGS Earthquake data via ArcGIS Online. Explore spatial patterns and layered displays to understand social and scientific implications of earthquakes. Develop maps and presentations to discuss findings and patterns.


GIS and Business Tech Workshop: Visualizing Earthquake Data
E N D
Presentation Transcript
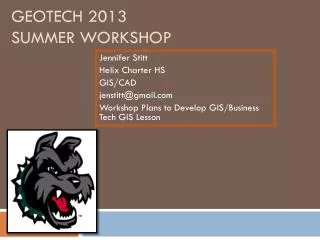
GeoTech 2013 Summer Workshop Jennifer Stitt Helix Charter HS GIS/CAD jenstitt@gmail.com Workshop Plans to Develop GIS/Business Tech GIS Lesson
Infusing GIS in Business Tech Class Students will download USGS Earthquake CSV data and display and analyze the data via ArcGIS online. Driving Question: How can data be visualized in a spatial manner? Thus, once visualized, what other layers can be utilized in order to see social and science patterns associated with earthquakes. Choose a Basemap Drag in Table or Import file to ArcGIS Online Display Data What patterns to do you see? Find at least 3 layers to add in to display with your map Create a PowerPoint presentation on your map and present to class, be sure to discuss patterns and ask why, why, why?
GIS: Helix the Heat Island Driving Question: Do you believe Helix Charter HS campus exhibits the heat island effect? What is the heat island effect? • Students will work in groups of 3-4 • Equipment: GPS, Science Probe, Empty Data Table (Paper), Mobile Device (if applicable) • Campus is divided into several zones. • Students will take temp, humidity, wind readings in each zone at different areas in the zone. Each Zone: Shade Concrete, Shade Grass, and Sun Concrete, Sun Grass • Students will also choose one extra thing to map, trash, cell phone bars, etc. CEO Rachel prepares darts for Elephant Rescue Effort
GIS: Heat Island Continued After students map out campus, they will begin to load their data into notepad and then bring their data into ArcGIS online. Look for patterns, answer questions based on hot spots around campus for data complied. Then after data is looked at students will develop story maps to describe their journey around campus. (need lesson for Story Maps) Students are encourage to take pictures with smart phones while they work around campus • Map Data • Poaching routes • Elephant Mortality • Seasonal Trends – Snaring and Poaching http://www.elephantdatabase.org/
Business Tech Lesson • Go to: http://earthquake.usgs.gov/earthquakes/ CLICK HERE
Business Tech Lesson • Keep options the same, except change the date to your BIRTHDAY!
Date Selection, Business Tech My Birthday
Continued Get results and click on CSV link
Once you click on CSV • Right click all the text on page and save as a .txt file in your folder. • QuakeBirthday.txt
Putting .txt file into the map. • Go to: http://www.arcgis.com/home/ • Login: T3GS149 Password: raider1978
Getting data into map • Once logged in, go to MAP at the top of web-page: go to ADD
Adding Data • Add Data from a file and navigate to your .txt file.
The MAP • 1000 features only….it is ok if you get this message.
Map Extras • Change up your birthdayquake layer • Add in three different layers and compare earthquakes to other data. • What patterns do you see? • Save three maps, make sure your name is with your title: • Jstittquake1 • Jstittquake2, etc.
Final Maps • Here is what your map may look like at the end…changed symbology of quakes by depth, and added in World Pop Density…a question I could ask would be, do quakes tend to occur near highly populated places? What other factors may lead to people wanting to live in these areas?