U87 non-stem
non-stem. non-stem. stem-like. stem-like. B. C. D. P = 0.06. 25. - pStat3 (91 kDa). non-stem. non-stem. stem-like. stem-like. non-stem. non-stem. 20. M r [kDa]. - Stat3 (91 kDa). stem-like. stem-like. 250 -. - TLR9 (180 kDa). 15. 150 -. - MSI-1 (39 kDa). Tlr9 mRNA.

U87 non-stem
E N D
Presentation Transcript
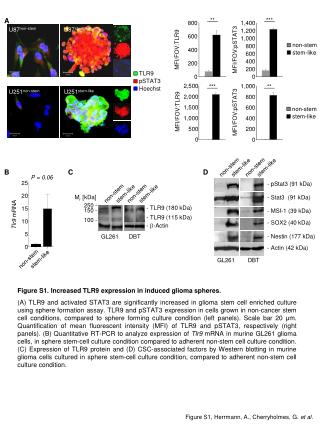
non-stem non-stem stem-like stem-like B C D P = 0.06 25 - pStat3 (91 kDa) non-stem non-stem stem-like stem-like non-stem non-stem 20 Mr [kDa] - Stat3 (91 kDa) stem-like stem-like 250 - - TLR9 (180 kDa) 15 150 - - MSI-1 (39 kDa) Tlr9 mRNA - TLR9 (115 kDa) 100 - 10 - SOX2 (40 kDa) - b-Actin 5 - Nestin (177 kDa) GL261 DBT 0 - Actin (42 kDa) GL261 DBT non-stem stem-like A ** *** 800 1,400 U87non-stem U87stem-like 1,200 600 1,000 800 MFI/FOV:TLR9 MFI/FOV:pSTAT3 400 600 400 200 200 TLR9 0 0 pSTAT3 2,500 1,000 *** ** Hoechst U251non-stem U251stem-like 2,000 800 1,500 600 MFI/FOV:TLR9 MFI/FOV:pSTAT3 1,000 400 500 200 0 0 Figure S1.Increased TLR9 expression in induced glioma spheres. (A) TLR9 and activated STAT3 are significantly increased in glioma stem cell enriched culture using sphere formation assay. TLR9 and pSTAT3 expression in cells grown in non-cancer stem cell conditions, compared to sphere forming culture condition (left panels). Scale bar 20 μm. Quantification of mean fluorescent intensity (MFI) of TLR9 and pSTAT3, respectively (right panels). (B) Quantitative RT-PCR to analyze expression of Tlr9 mRNA in murine GL261 glioma cells, in sphere stem-cell culture condition compared to adherent non-stem cell culture condition. (C) Expression of TLR9 protein and (D) CSC-associated factors by Western blotting in murine glioma cells cultured in sphere stem-cell culture condition, compared to adherent non-stem cell culture condition. Figure S1, Herrmann, A., Cherryholmes, G. et al.
A B none, n = 4 P = 0.007 P = 0.03 P = 0.03 CpG-ODN1668, n = 4 5 10 35 400 ** 30 350 4 8 300 25 ** 3 6 250 none none 20 Sox2 mRNA Nestin mRNA No. of spheres, Ø1-2 mm 200 CpG CpG No. of spheres 15 2 4 150 10 100 1 2 5 50 0 0 0 0 0 2 4 6 8 Days P = 0.013 P = 0.013 0 2.0 2.5 U251 2.0 DBTnt-shRNA, n = 9 1.5 stem-like non-stem – 1 DBTTlr9-shRNA (1), n = 9 nt-shRNA 1.5 DBTTlr9-shRNA (2), n = 9 Sox2 mRNA 1.0 Nestin mRNA 350 Tlr9-shRNA aStat3 aStat3 IgG IgG 1.0 ChIP: non-responding [log] – 2 300 0.5 0.5 250 - TLR9 GL261 200 0 0 – 3 No. of spheres - TLR9 150 DBT nt-shRNA, n = 24 100 – 4 Input *** 50 *** TLR9shRNA1, n = 24 *** 0 100 200 300 400 500 *** 0 TLR9shRNA2, n = 24 number of cells 0 2 4 6 Days P = 0.051 2.0 1.5 Musashi-1 mRNA 1.0 F G P = 0.01 P = 0.03 0.5 1.2 1.2 0 1.0 1.0 0.8 0.8 scr-shRNA STAT3 mRNA TLR9 mRNA 0.6 0.6 STAT3-shRNA 0.4 0.4 0.2 0.2 0 0 C D % of Max. TLR9 BLANK 2nd ab ctrl DBT-nt-RNA DBT-Tlr9shRNA#1 DBT-Tlr9shRNA#2 E Figure S2, Herrmann, A., Cherryholmes, G. et al.
Figure S2.TLR9 and STAT3 form a feed-forward loop in GSCs. (A) Sphere formation assay to phenocopy cancer stem cell-like cells upon TLR9 signaling activation in DBT glioma spheres triggered with CpG-ODN. SD and significance are shown: *P ≤ 0.05; **P ≤ 0.01. Quantification of sphere diameter at day 8 of sphere formation is shown. SD shown and significance are indicated. (B) Quantitative RT-PCR of Sox2 and Nestin mRNA levels in DBT spheres with or without CpG-ODN treatments. SD and significance are shown. (C) Effect of TLR9 signaling on human GSC-like cells using limiting dilution assays. U251 glioma spheres stably transduced with indicated TLR9shRNAs were grown in stem cell-enriching (sphere-forming) culture conditions, followed by a limiting dilution assay to assess the frequency of GSCs. (D) Tlr9shRNA was introduced into DBT glioma cells and TLR9 protein knockdown efficacy was determined by flow cytometry (left panel). Sphere formation assay of murine DBT glioma cells expressing shRNA against Tlr9 in sphere stem-cell culture condition. SD and significance shown: *P ≤ 0.05; **P ≤ 0.01; ***P ≤ 0.001 (right panel). (E) Analysis of mRNA expression levels of stem cell-associated factors in glioma such as Msi-1, Sox2, and Nestin by RT-PCR upon introduction of Tlr9 shRNA; SD and significance are shown. (F) Chromatin immunoprecipitation (ChIP) of Stat3 binding to the Tlr9 promoter in GL261 and DBT murine glioma cells cultured in sphere stem-cell culture condition, compared to adherent non-stem cell culture condition. (G) Expression of STAT3 mRNA and TLR9 mRNA levels upon STAT3 knockdown in human glioma cells grown in sphere culture condition analyzed by quantitative RT-PCR. SD and significance are shown. Figure S2 cont’d, Herrmann, A., Cherryholmes, G. et al.
vehicle, n = 4 DBT CpG-lucsiRNA, n = 4 CpG-Stat3siRNA, n = 4 1,500 1,250 1,000 750 Tumor volume [mm3] 500 250 * * * 0 8 10 12 14 Neovasculature Days ECM Annexin V Vehicle, n = 8 CpG, n = 8 CpG-Stat3siRNA, n = 8 A B none CpG-Stat3siRNAFITC CpG-Stat3siRNAFITC Hoechst33342 none CpG-Stat3siRNAFITC SSC-H 1.17 86.30 FL-1A:: FITC none CpG-lucsiRNA CpG-Stat3siRNA C D DBT GL261 none CpG-lucsiRNA CpG-Stat3siRNA none CpG-lucsiRNA CpG-Stat3siRNA Hoechst pStat3 CD31 Hoechst Hoechst cl.Casp.3 125 E 100 75 Percent Survival 50 25 0 0 20 40 60 80 100 Days Figure S3, Herrmann, A., Cherryholmes, G. et al.
Figure S3. Stat3 silencing by local CpG-Stat3siRNA delivery inhibits tumor growth. (A) Internalization of CpG-Stat3siRNA-FITC into glioma tumors engrafted subcutaneously visualized by in vivo multi-photon imaging (upper panel, scale bar 50 mm) and quantified by flow cytometry (lower panel). (B) Tumor growth of DBT murine glioma in immunocompromised mice treated locally as indicated. SD and significance shown (*P ≤ 0.05). (C) Tumor vasculature and induction of cell apoptosis in DBT murine glioma treated with CpG-Stat3siRNA, CpG-lucsiRNA, or left untreated was analyzed by in vivo multi-photon imaging. Scale bar 100 mm. (D) Antitumor effects on glioma treated with CpG-Stat3siRNA, CpG-lucsiRNA, or vehicle controlwas analyzed in two rodent glioma models DBT and GL261, respectively, showing decreased Stat3 activation (upper panel), diminished tumor CD31+ vasculature (middle panel) and cleaved caspase 3+ induced tumor cell apoptosis (lower panel). Scale bar 100 mm. (E) Improved survival rate as a result of locally administered CpG-Stat3siRNA was acquired in a syngenic model by treating mice bearing brain tumors twice a week for two weeks. CpG1668 and vehicle treatment were included as controls. Significance shown (**P ≤ 0.01). Figure S3 cont’d, Herrmann, A., Cherryholmes, G. et al.
A B DBT none, n = 6 CpG-lucsiRNA, n = 6 1,000 CpG-Stat3siRNA, n = 6 800 600 No. of spheres 400 ** 200 0 0 2 4 6 Days DBTsphere 0’ 30’ 60’ 120’ 0.0 91.7 93.7 95.6 SSC-H CpG-Stat3siRNA-FITC C P=0.024 P=0.008 P=0.008 P=0.001 4.0 1.4 3.0 1.6 1.4 1.2 2.5 3.0 1.2 1.0 2.0 1.0 0.8 none, n = 3 Stat3 mRNA 2.0 Tlr9 mRNA Sox2 mRNA SSEA1 mRNA 1.5 0.8 0.6 CpG-lucsiRNA, n = 3 0.6 1.0 CpG-Stat3siRNA, n = 3 0.4 1.0 0.4 0.5 0.2 0.2 0 0 0 0 D none CpG-lucsiRNA CpG-Stat3siRNA pStat3 Nestin Hoechst TLR9 Nestin Hoechst Figure S4, Herrmann, A., Cherryholmes, G. et al.
Figure S4. Stat3 silencing by local CpG-Stat3siRNA delivery inhibits GSCs. (A) Internalization of CpG-Stat3siRNA-FITC into DBT glioma sphere culture determined by flow cytometry. (B) Sphere formation capacity of DBT murine glioma cells upon CpG-Stat3siRNA treatment compared to controls as indicated. SD and significance shown (*P ≤ 0.05; **P ≤ 0.01). (C) Quantitative RT-PCR analyses showing mRNA levels of stem cell associated factors in glioma tumors grown subcutaneously and treated as indicated. SD and P values shown. (D) Confocal microscopic analyses showing protein levels of pStat3 and TLR9 in Nestin+ tumor areas from tumors treated with indicated CpG-siRNAs. Scale bar 100 mm. Figure S4 cont’d, Herrmann, A., Cherryholmes, G. et al.
P = 0.25 8 P = 0.07 7 none CpGscrRNA CpGlucsiRNA 6 5 none BLU 106 CpGscrRNA 4 CpGlucsiRNA 3 2 1 0 Figure S5. Targeting Brain tumors systemically with CpG-siRNA reaches the tumor site. Xenogen imaging of GL261luc+ brain tumors orthotopically engrafted in C57BL/6 mice showing decreasing bioluminescent signals upon treatment with CpG-lucsiRNA as well as indicated controls (left panel). Luciferase signals upon indicated treatments was acquired by non-invasive xenogen imgaging and quantified. P values shown (right panel). Figure S5, Herrmann, A., Cherryholmes, G. et al.