Download

1 / 23
230 likes | 250 Vues
Explore the impact of climate change on urban areas, focusing on risks such as floods, heat islands, and extreme events, and how GIS technology can be used for assessment and mitigation. Learn about urbanization challenges and practical GIS applications for development.

E N D
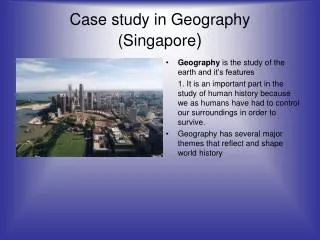
The Case for 3D Singapore Terence Tan Infocomm Development Authority of Singapore
GIS AND CLIMATE CHANGE Dr. Jyoti Parikh Executive Director B-44, Shivalik, Malviya Nagar, New Delhi www.irade.org, jparikh@irade.org
6 Major Climate Risks • Temperature and precipitation variability • Drought • Flooding and extreme rainfall • Cyclone and storm surge • Sea-level rise • Environmental health risks
Flood prone areas of India Source: www.climate-transitions.org Wind and Cyclone prone areas of India Source: www.climate-transitions.org
Urbanization • From 1975 to 2015 the number of people in urban areas is projected to more than double. • By 2030, nearly two-thirds of the world's population will live in urban areas • Population growth and in-migration of poor people, industrial growth, inefficient and inadequate traffic corridors, poor environmental infrastructure, etc. are the main factors that have deteriorated the overall quality of the city environment. • Urbanization negatively impacts the environment mainly by the fabrication of pollution, the alteration of the physical and chemical properties of the atmosphere, and the covering of the soil surface and it represent the quality of climate over city. (Sources: Food and Agriculture Organization statistical databases (FAOSTAT); Country income to world Bank 2007) Ratio of Urban and Rural Population, 2007
Significant Urban floods in India in recent years • 2005 ‐ Severe urban floods were reported from 10 cities and Mumbai was worst affected. • 2006 ‐ Number of affected cities rose to 22. Surat was worst affected. Vishakhapattanam airport was inundated for more than 10 days. • 2007 – Number of affected cities rose to 35. Kolkata was worst affected. • 2008 ‐ Jamshedpur, Mumbai, Hyderabad were worst affected Source: National Institute of Disaster Management (NIDM)
Flood level During 1998 floods Surat Floods: 1998 Flood Above 6 feet Flood 4’-6’ Flood 2’-4’ Source:- Surat CDP Flood 0’-2’
Flood level During 2006 floods Surat Floods: 2006 More than 10’ Depth 5’-10’ Depth Source:- Surat CDP 4’-6’ Depth
Urban heat island • Cause of the urban heat island: • Modification of the land surface by urban development which uses materials which effectively retain heat; • Waste heat generated by energy usage is a secondary contributor. • The urban canopy layer (UCL) is the layer of air closest to the surface in cities, extending upwards to approximately the mean building height. • Above the urban canopy layer lies the urban boundary layer (UBL), which is 1km in thickness. Source: Research paper by Swarnima Singh OnGIS APPLICATION IN URBAN HEAT ISLAND: A CRUSADING ANTHROPOGENIC DRIVER TO CLIMATE CHANGE
Urban Heat Island • Remote sensing instrument used for UHI: ASTER: Advanced Space-borne Thermal Emission and Reflection Radiometer • Advanced along Track Scanning Radiometer (AASTAR) and PALSAR are used for estimating surface temperature and land cover change • By utilizing remote sensing data and implementing GIS mapping techniques, change detection over a period of time of the urban areas can be monitored and mapped. Spatial Pattern of Urban Heat Island (an overlay of AASTER AND PALSAR data analysis) Source: Research paper by Swarnima Singh OnGIS APPLICATION IN URBAN HEAT ISLAND: A CRUSADING ANTHROPOGENIC DRIVER TO CLIMATE CHANGE
Land Use / Land Cover • Space-borne remote sensing data can be used for estimation of biomass and biodiversity, • Geo-spatial modeling techniques can be employed to estimate carbon sequestration patterns Project of Centre for Development of Advanced computing (C-DAC); on Landscape Dynamics with Emphasis on Landuse / Landcover Changes vis-a-vis Carbon Sequestration and Habitat Loss. Source: C-DAC website
Probable Maximum Precipitation (PMP) • Measurements from all rain gauge stations to map/link to entire basin • Preparation of seasonal and annual rainfall maps • Severe rainstorm map • Digital drainage map • Isohyetal patterns (line joining points of equal precipitation) of all historical rainstorms • Development of interactive software for estimation of storm parameters for any given study area and tool for storm transposition on the digital map.
Water • GIS for Flood control, Soil conservation, Water conservancy, Salinity ingress, Watershed management, Groundwater assessment and management • Digital Elevation Model (DEM) data are layered with hydrographic data so that the boundaries of a watershed may be determined. • Groundwater modeling simulation devised to fully capture the contaminants in water • Mapping of flood-affected and snow cover using satellite images • Lakes and Wetlands classification and modeling
Snow cover monitoring • GIS based Avalanche Information System can be used for making maps, updated with satellite imagery and ancillary data • Multi-temporal optical and microwave remote sensing data Development of Near Real Time Snow Cover Monitoring; Project of C-DAC Source: C-DAC website
Biodiversity GIS helps in Forest Management for following purpose: Location: location of forest resource Trends: changes happened over time Patterns: spatial patterns existing Modeling: what if case? If road network added etc Remote sensing & GIS based modeling to develop spatial indices depicting the status of forest ecosystem • Preparation of biological maps • Biodiversity characterization at landscape level Biological richness map of the proposed Rajmachi Wildlife Sanctuary near Khandala C-DAC project on Biodiversity Characterization Source: C-DAC website
Landslide GIS helps in landslide zonation in:- Helps in identifying strategic points Geographically critical areas prone to landslides. • Thematic mapping using Optical and microwave RS data • Landslide inventory mapping using GPS • Landslide hazard zonation using GIS techniques Micro-zonation & risk assessment of landslide affected areas in Itanagar, Arunachal Pradesh Source: C-DAC website
Risk Assessment • GIS and RS to hazard, vulnerability and risk (HVR) assessment Important for better disaster preparedness. • Includes early warning systems • GIS in conjunction with remote sensing and photogrammetry, can be used to identify hazards. • Seismic Hazard Assessment: Active Fault Study, Geology Study, Seismic Hazard Mapping • Vulnerability Mapping: Building Stock, Essential Facility, Population, transportation System, Utility System
Concluding Comments • Climate change has increased the relevance of GIS • With increasing risk and impacts, GIS - an inevitable tool to be used regularly • Increase effectiveness in conjunction with remote sensing to monitor impacts • GIS is a sophisticated technology tool already in widespread use by planners, engineers, and scientists to display and analyze all forms of location-referenced data related to climate change and its impacts. • GIS can saves lives