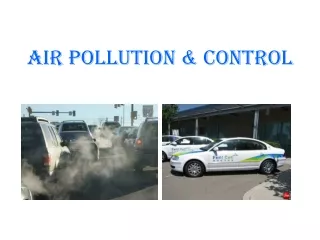
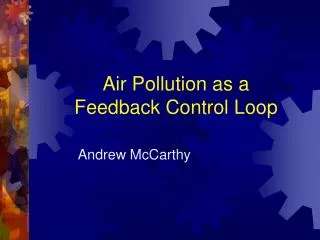
Air Pollution as a Feedback Control Loop
Air Pollution as a Feedback Control Loop. Andrew McCarthy. Introduction. Air Pollution Feedback Control Purpose and Components of Feedback Components of Air Pollution Feedback Control, with Mercury as a specific example. Air Pollution Feedback Control.

Air Pollution as a Feedback Control Loop
E N D
Presentation Transcript
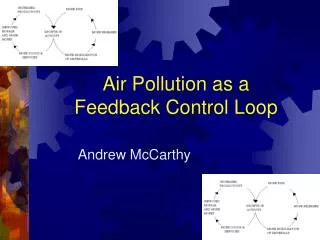
Air Pollution as a Feedback Control Loop Andrew McCarthy
Introduction • Air Pollution Feedback Control • Purpose and Components of Feedback • Components of Air Pollution Feedback Control, with Mercury as a specific example
Air Pollution Feedback Control A feedback control system is a metaphor for air pollution.
Air Pollution Feedback Control Economic growth has benefits, but with those benefits come risks, such as those caused by air pollution. As a result, the growth must be controlled.
Purpose of Feedback The primary reason for feedback control is to measure and compensate for the effect of disturbances.
4 Elements of Feedback • Sensor • Reference Input • Comparator • Control Mechanism www.oz.net/~coilgun/levitation/feedbackloop.htm
Sensor The sensor measures the variable that we seek to control, also known as the control variable.
How is pollution sensed? • Monitoring agencies use EPA approved equipment. PM and lead are measured over a 24 hour period, whereas gaseous pollutants are measured hourly. Collected data is then compared to the Clean Air Act standards (NAAQS) for each pollutant. • In the case of Mercury, U.S. Bureau of Mines data is examined for the following categories: electrical, paint, agricultural chemicals, measuring and control instruments, lab use, pharmaceutical, dental, chlorine, caustic soda manufacturing, and other. This data does not give a complete picture of the amount of mercury that goes into the air; it only tells what is mobilized. In order to determine how much mercury is emitted into the air, this is combined with emission data such as 50% for coal, 75% for paint, and 30% for electrical, control equipment, and lab use. This combined with mobilization data, gives an accurate picture of the amount of mercury emitted. http://www.epa.gov/region08/air/monitoring/monitoring.html
Reference Input This specifies the value the controlled variable should have.
Pollution Reference Value The EPA creates Clean Air Act standards (NAAQS) for each pollutant. This sets a standard for the ambient presence of pollutants. Additionally, the EPA sets emission standards for a wide range of pollutants. For the case of mercury, the EPA sets standards depending upon the use. (ie 50 ppm for paint, 50% reduction by chlor-alkali industry by 2005, 90% emission reduction by municipal waste combustors by 2000, and 95% emission reduction by medical waste incinerators) http://www.epa.gov/region08/air/monitoring/monitoring.html http://www.usgs.gov
Pollution Reference Value NAAQS represent the reference values: Carbon Monoxide (9 ppm, 8 hour) PM10 (150ug/cubic meter, 24 hour) PM2.5 (65ug/cubic meter, 24 hour) Ozone (.08 ppm, 8 hour) Sulfur Oxides (.14 ppm, 24 hour) http://www.epa.gov/air/criteria.html
Comparator Compares the sensed value with the reference value. It also specifies the magnitude of the correction that needs to be made. (ie barely exceeding the standard vs. exceeding the standard by a large margin)
Air Pollution Comparator The EPA compares the data collected by monitoring sites to the Clean Air Act Standard. The EPA can, in the case of Mercury, monitor certain industries, such as the paint industry, and the products they produce to determine if mercury levels are within their guidelines. http://www.epa.gov/region08/air/monitoring/monitoring.html
Control Mechanism Takes the output of the comparator and makes corrective measures while progress toward the air quality standard is continuously tracked. Disturbance has been added to the system to illustrate that progress toward the standard is an iterative process and not a single step process.
Air Pollution Control Mechanism If pollution levels are above the NAAQS and present a risk, the monitoring agency in the state must develop and implement a plan to reduce the air pollution. If mercury levels are too high in a given industry, the EPA can levy stiff financial penalties, and the industry opens itself to litigation. http://www.epa.gov/region08/air/monitoring/monitoring.html
Conclusion • A feedback control system was presented as a metaphor for air pollution. • Four components of air pollution feedback control were presented: sensor, reference input, comparator, and control mechanism. • Mercury was examined as a specific example by looking at how mercury is sensed, how the EPA sets the reference input, how the sensed value is compared to the EPA’s standards, and the measures that the EPA takes to ensure that once an out of compliance value is sensed that it can be brought back into compliance.
References http://www.oz.net/~coilgun/levitation/feedbackloop.htm http://www.acfr.usyd.edu.au/teaching/3rd-year/mech3800-SystemsControl/material/lectures/block%20diagrams.pdf http://www.engin.umich.edu/group/ctm/examples/examples.html http://www.epa.gov/region08/air/monitoring/monitoring.html http://www.epa.gov/air/criteria.html http://www.usgs.gov