2.5 Using Linear Models
2.5 Using Linear Models. Month. Temp. 1. 69 º F. 2. 70 º F. 3. 75 º F. 4. 78 º F. 2.5 Using Linear Models. Scatter Plot – A graph that relates two sets of data by plotting the data as ordered pairs. 2.5 Using Linear Models.


2.5 Using Linear Models
E N D
Presentation Transcript
2.5 Using Linear Models Month Temp 1 69 º F 2 70 º F 3 75 º F 4 78 º F
2.5 Using Linear Models Scatter Plot – A graph that relates two sets of data by plotting the data as ordered pairs
2.5 Using Linear Models • A scatter plot can be used to determine the strength of the relation or the correlation between data sets. • The closer the data points fall along a line with a positive slope, • The stronger the linear relationship, and • the stronger the positive correlation
2.5 Using Linear Models Describe the correlation shown in each graph. STRONG POSITIVE CORRELATION WEAK POSITIVE CORRELATION
2.5 Using Linear Models STRONG NEGATIVE CORRELATION NO CORRELATION
2.5 Using Linear Models • Is there a positive, negative, or no correlation between the 2 quantities? • If there is a positive or negative correlation, is it strong or weak?
2.5 Using Linear Models A person’s age and his height Height (in feet) POSITIVE Age (in years) STRONG
2.5 Using Linear Models A person’s age and the number of cartoons he watches NEGATIVE WEAK
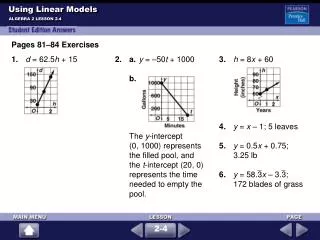
2.5 Using Linear Models • The table shows the median home prices in New Jersey. An equation is given that models the relationship between time and home prices. Use the equation to predict the median home price in 2010.
2.5 Using Linear Models y = 2061x + 47,100 where x is the number of years since 1940 and y is the price
2.5 Using Linear Models y = 2061x + 47,100 2010 is 70 years after 1940, so x = 70. y = 2061(70) + 47,100 = $191,370 The median home price in New Jersey will be approximately $191,370.
2.5 Using Linear Models • Assignment: • p.96-97(#8,12bc,14bc,15-17) • For #12 & 14, use these equations. • 12.) y = 2053.17x – 4,066,574.67 • x = year (NOT # of years since 2000) • 14.) y = 0.0714x – 9.2682
2.6 Families of Functions • A parent function is the basic starting graph. • A transformation is a change to the parent graph. • Transformations can be translations or shifts of the graph up or down or left or right.
2.6 Families of Functions Examples of transformations
2.6 Families of Functions TRANSLATION UP or DOWN Begin with y = f(x). To shift that graph up ordownc units, we will write it y = f(x) + c. y = f(x) + 3 y = f(x) – 5
2.6 Families of Functions TRANSLATION LEFT OR RIGHT Begin with y = f(x). To shift that graph leftor right c units, we will write it y = f(x + c) or y = f(x − c). y = f(x + 4) y = f(x − 6)
2.6 Families of Functions + 4 + 4 • Given the graph of y = f(x), graph y = f(x) .
2.6 Families of Functions – 3 – 3 • Given the graph of y = f(x), graph y = f(x) .
2.6 Families of Functions + 4 + 4 • Given the graph of y = f(x), graph y = f(x ).
2.6 Families of Functions – 3 – 3 • Given the graph of y = f(x), graph y = f(x ).
2.6 Families of Functions – 2 – 2 + 1 + 1 • Now, if y = f(x), graph y = f(x ) .
2.6 Families of Functions • Assignment: • Worksheet (2.6) Translations
2.6 Families of Functions ANSWERS TO WORKSHEET 1. f(x + 5)
2.6 Families of Functions ANSWERS TO WORKSHEET 2. f(x) – 3
2.6 Families of Functions ANSWERS TO WORKSHEET 3. f(x) + 3
2.6 Families of Functions ANSWERS TO WORKSHEET 4. f(x ‒ 1) + 2
2.6 Families of Functions ANSWERS TO WORKSHEET 5. f(x + 3) ‒ 4
2.6 Families of Functions ANSWERS TO WORKSHEET 6. f(x ‒ 5) ‒ 3
2.6 Families of Functions • More Transformations: • Reflection • f(−x) is a flip of f(x) over the y-axis. • − f(x) is a flip of f(x) over the x-axis.
2.6 Families of Functions • More Transformations (continued): • Stretch • a∙f(x) is a vertical stretch by a factor of a; a > 1 • Compression • a∙f(x) is a vertical compression by a factor of a; 0 < a < 1
2.6 Families of Functions Given y = f(x), graph y = f(– x).
2.6 Families of Functions Given y = f(x), graph y = – f(x). 32
2.6 Families of Functions Given y = f(x), graph y = 2f(x).
2.6 Families of Functions Given y = f(x), graph y = –3f(x).
2.6 Families of Functions Given y = f(x), graph y = ½ f(– x).
2.6 Families of Functions Given y = f(x), graph y = –2f(x) + 3.
2.6 Families of Functions • Assignment: • Worksheet (2.6 Enrichment)
2.6 Families of Functions ANSWERS ENRICHMENT WORKSHEET 4. y = 2f(x)
2.6 Families of Functions ANSWERS ENRICHMENT WORKSHEET 5. y = f(x) – 1
2.6 Families of Functions ANSWERS ENRICHMENT WORKSHEET 6. y = f(x + 4)
2.6 Families of Functions ANSWERS ENRICHMENT WORKSHEET 7. y = 2f(x + 4) – 1
2.6 Families of Functions ANSWERS ENRICHMENT WORKSHEET 8. y = f(x – 2)
2.6 Families of Functions ANSWERS ENRICHMENT WORKSHEET 9. y = – 2f(x) + 1
2.6 Families of Functions ANSWERS ENRICHMENT WORKSHEET 10. y = f(x + 3) – 4
2.7 Absolute Value Graphs & Graphs Graph f(x) = |x|. 2 1 0 1 2
2.7 Absolute Value Graphs & Graphs • Use the previous absolute value graph to answer the questions. • What is the vertex? • What are the slopes of the rays? • What way does the graph open? • What is the equation of the axis of symmetry? (0,0) +1 and – 1 Up! x = 0
2.7 Absolute Value Graphs & Graphs • VERTEX FORM OF AN ABSOLUTE VALUE GRAPH
2.7 Absolute Value Graphs & Graphs • The absolute value graph shifts UP if you see + k after the absolute value. • The absolute value graph shifts DOWN if you see − k after the absolute value.
2.7 Absolute Value Graphs & Graphs Graph f(x) = |x| + 5 . Shift the graph of f(x) = |x| UP 5 units!!! Remember to keep the slopes of the rays +1 and – 1!!!
2.7 Absolute Value Graphs & Graphs • Use the previous absolute value graph to answer the questions. • What is the vertex? • What are the slopes of the rays? • What way does the graph open? • What is the equation of the axis of symmetry? (0,5) +1 and – 1 Up! x = 0