Download
1 / 27
270 likes | 411 Vues
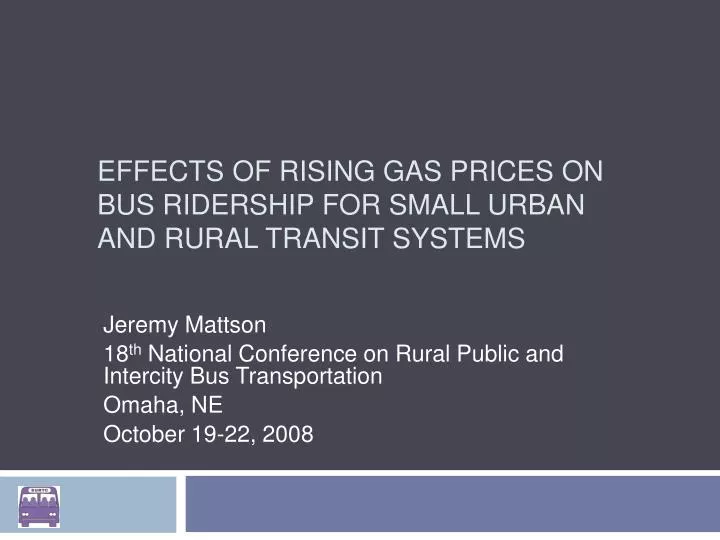
Effects of Rising Gas Prices on Bus Ridership for Small Urban and Rural Transit Systems. Jeremy Mattson 18 th National Conference on Rural Public and Intercity Bus Transportation Omaha, NE October 19-22, 2008. U.S. Fuel Prices, 1998-2008. Have Drivers Responded?.

E N D
Effects of Rising Gas Prices on Bus Ridership for Small Urban and Rural Transit Systems Jeremy Mattson 18th National Conference on Rural Public and Intercity Bus Transportation Omaha, NE October 19-22, 2008
Have Drivers Responded? • Vehicle miles traveled (VMT) began decreasing in 2007. • There was a 4.7% decrease (12.2 billion miles) in travel on all U.S. roads and streets in June 2008 compared to June 2007. • Through June, travel was down 2.8% (42.1 billion miles) in 2008 compared to 2007. • Public transportation ridership in 2007 was the highest in 50 years. • In the second quarter of 2008, transit ridership was up 5.2% compared to the second quarter of 2007.
Transit Ridership Data Sources • American Public Transportation Association (APTA) • Aggregate nationwide data • National Transit Database • Annual data for regional small urban systems • Specific Transit Systems • Fargo Metro Area Transit (MAT) • Clay County Rural Transit (CCRT) • Cheyenne Transit Program (CTP)
Trends in Rail Ridership Source: APTA
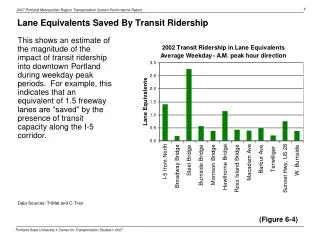
Trends in Bus Ridership Source: APTA
Ridership Increases Through First Half of 2008 Source: APTA
Factors Affecting Ridership • Internal factors • Fares, service quantity and quality • External factors • Gas price, socioeconomic factors (employment level, income level, car ownership), spatial factors (parking cost, population densities), and others
Previous Research on Gas Prices and Ridership • Ridership has generally not been too responsive. • Effects differ from city to city and system to system. • Rail tends to be affected more. • Demand for longer-distance transit trips is affected more. • Commuters and students are more likely to switch to transit than shoppers or leisure travelers. • Long-run effects differ from short-run effects.
Empirical Model • Polynomial Distributed Lag Model • Applied to monthly data from APTA and three individual transit systems. • Ridership is estimated as a function of current gas price, previous gas prices, seasonality, trends, changes in fares or service levels, other community-specific variables. • Panel Data Model • Applied to annual data from the National Transit Database for 11 small urban transit systems of the Upper Great Plains. • Ridership is estimated as a function of regional gas price, service quantity, fares, size of labor force, unemployment rate, time trend, cross section dummy variables, dummy variables for specific systems (e.g., implementation of U-Pass system in Fargo).
Other Results • Significant seasonality in ridership. • North Dakota State University has had a significant impact on ridership for Fargo’s MAT. • A decrease in service in Fall 2005 for CCRT had a large negative effect on ridership, and an increase in fares also had a negative, but much smaller, effect. • Service changes have affected ridership in Cheyenne. • Ridership is also trending upward in Cheyenne due to other factors.
Panel Data Model • Annual data for 11 transit systems from the Upper Great Plains for 1997-2006 • Duluth Transit Authority (Duluth, MN) • St. Cloud Metropolitan Transit Commission (St. Cloud, MN) • City of Rochester Public Transportation (Rochester, MN) • Sioux Falls Transit (Sioux Falls, SD) • Fargo-Moorhead Metro Area Transit (Fargo, ND/Moorhead, MN) • Billings Metropolitan Transit (Billings, MT) • Cities Area Transit (Grand Forks, ND) • Missoula Urban Transportation District (Missoula, MT) • Great Falls Transit District (Great Falls, MT) • Rapid Transit System (Rapid City, SD) • City of Cheyenne Transit Program (Cheyenne, WY)
Panel Data Results - Trend variables and dummy variables are also highly significant.
Average Annual Growth Rates for Fare Revenue and Fuel Costs, 2002-2006
Comparison of Fare Revenue and Fuel Expense Increases, 2002-2006
How are Transit Agencies Responding? • APTA survey (conducted July ’08) shows: • 85% of public transit systems report capacity problems • 91% are facing problems in ability to add service to meet increased demands • 60% are considering fare increases • 35% are considering service cuts
Conclusions • Ridership has been increasing for transit systems of all types. • Previous research shows that demand for transit does not respond in a significant way to changes in gas price. • Results from this study show elasticity estimates ranging from 0.08 to 0.5, averaging around 0.1-0.2.
Conclusions • While the elasticities are small, there is still a measurable impact on ridership due to the substantial increases in gas prices. • Further research with updated data could be needed to determine if the elasticities change as prices continue rising (do motorists have a tipping point?).
Conclusions • Motorists in larger urban areas are quicker to switch to transit, possibly due to greater familiarity. • Over time, the response in small urban and rural areas can be just as great. • Ridership on long-distance commuter routes could benefit the most.
Conclusions • The growth in fare revenues has not been enough to offset the large increases in fuel costs. • Demand for service is increasing while operating costs are increasing. • Transit agencies will have difficulties expanding service to meet the growing demand due to budget pressures caused by higher fuel costs.