Effects of selection
Effects of selection. The reproductive success of an individual over its lifetime is known as its fitness . When individuals differ in their fitness selection takes place. Measures of Fitness. In practice, fitness can be difficult to measure over an organisms lifetime.

Effects of selection
E N D
Presentation Transcript
Effects of selection • The reproductive success of an individual over its lifetime is known as its fitness. • When individuals differ in their fitness selection takes place.
Measures of Fitness • In practice, fitness can be difficult to measure over an organisms lifetime. • Instead other measures that correlate well with lifetime fitness are used to estimate fitness: e.g. survival to reproductive age or reproductive success in a single season.
Measuring fitness • The goal in studying selection is to relate variation in fitness to variation in phenotype. • E.g. we can try to compare variation in fitness to an animal’s size or camouflage color or some other phenotypic measure.
Measuring fitness • Remember, fitness is a result of the organisms entire phenotype. • Population genetics, however, looks at the evolution of alleles at a singlelocus.
Relative fitness • Population geneticists condense all the components of fitness (survival, mating success, etc.) into one value of fitness called w.
Converting genotype fitness to allele fitness • Evolution depends on changes in the gene pool so we need to consider how alleles affect fitness rather than how genotypes affect fitness. • The general selection model (next slide) enables us to assess how individual alleles contribute to fitness.
General selection model for diploid organisms Genotype A1A1 A1A2 A2A2 Initial freq p2 2pq q2 Fitness w11 w12 w22 Abundance In gen t+1 p2 Xw11 2pq X w12 q2 Xw22 Weighted freq. gen t+1 (p2 X w11)/w (2pq X w12)/w (q2 Xw22)/w
General selection model for diploid organisms The term “Abundance in gen t+1” tells us for each genotype its abundance relative to other genotypes in the next generation Abund. gen t+1 p2 X w11 2pq X w12 q2 X w22 To convert these to true frequencies we standardize them by dividing them by the average fitness of the population w.
Formula for w (average fitness of population) for two alleles A1 and A2 • w = p2 X w11 + 2pq X w12 + q2 X w22 • Note that the formula is the sum of the fitness values for each genotype multiplied by (i.e. weighted by) the genotype frequencies.
General selection model for diploid organisms Normalized weighted freq. gen t+1 (p2 X w11)/w (2pq X w12)/w (q2 Xw22)/w These are the frequencies of each genotype in generation t +1.
General selection model for diploid organisms • Using these weighted genotype frequencies we can calculate the allelefrequencies in generation t+1. • Need to sum alleles across genotypes. • For the allele A1 it will be the frequency of the A1A1homozygotes plus half the frequency of the heterozygotes.
General selection model for diploid organisms • Frequency of allele A1 [p(t+1)] • P(t+1) = (p2 X w11 + pq X w12)/w • Frequency of allele A2 [q(t+1)] • q(t+1) = (q2 X w22 + pq X w12)/w
Example of allele change under selection Starting allele frequencies: A1 = 0.8, A2 = 0.2 Fitness w11 w12 w22 0.9 1.0 0.2 w = p2 X w11 + 2pq X w12 + q2 X w22 = (0.64 X 0.9) + (0.32 X 1) + (0.04 X 0.2) = 0.576 + 0.32 + 0.008 = 0.904
Example of allele change under selection P(t+1) = (p2 X w11 + pq X w12)/w P(t+1) = 0.64 X 0.9 + 0.16 X 1)/0.904 = 0.576 + 0.16/0.904 = 0.814 Allele A1 has increased in abundance slightly. In this example the success of the alleles A1 and A2 is very sensitive to the frequency of A2.
Example of allele change under selection • In this example, heterozygotes have the highest fitness, but if A2 becomes too common A2A2homozygotes begin to appear and these have very low fitness. • At lower frequencies of A2 then A2A2homozygotes will be rarer and the A2 allele will increase. • In next slide we lower frequency of A2 to 0.1.
Example of allele change under selection Allele frequencies: A1 = 0.9, A2 = 0.1 Fitness w11 w12 w22 0.9 1.0 0.2 w = p2 X w11 + 2pq X w12 + q2 X w22 = (0.81 X 0.9) + (0.18 X 1) + (0.01 X 0.2) = 0.729 + 0.18 + 0.002 = 0.911
Example of allele change under selection P(t+1) = (p2 X w11 + pq X w12)/w P(t+1) = (0.81 X 0.9 + 0.09 X 1)/0.911 = (0.729 + 0.09)/0.911 = 0.899 (allele A1has declined very slightly from frequency of 0.9 and allele A2 has increased to a frequency of 0.101
Average excess of fitness • There are other ways of computing the effects of selection on allele frequency. • One approach uses something called the average excess of fitness.
Average excess of fitness • A relatively simple formula allows us to calculate the net fitness contribution of an allele, which is called the averageexcessoffitness. • This is the difference between the average fitness of individuals with that allele and the average fitness of the entire population.
Equation for average excess of fitness for allele A1 (aA1) • For example, for the allele A1 the average excess of fitness is • aA1= [p X (w11 – w)] + [q X (w12 – w)] • Where w11 – w is the difference in fitness between A1A1 individuals and the mean fitness of the population w. • W12 is fitness of A1A2heterozygotes. W is mean fitness of population • P and q are allele frequencies • See Box 6.5 in your text page 168 for derivation of this formula.
Allele frequency change between generations • The average excess of fitness can be used to calculate how much an allele frequency will change between generations • Δp = p X (aA1/w) • Δp is change in allele frequency from one generation to the next • p is the frequency of the A1 allele • aA1 is the average excess of fitness • Average fitness of the population is w
Average excess of fitness • If the average excess of fitness is positive then an allele will increase in frequency. • If average excess of fitness is negative then the allele will decrease in frequency.
Allele frequency change between generations • Δp = p X (aA1/w) • The equation tells us that how fast an allele increases or decreases depends on both the strength of selection (value of aA1) AND how common an allele is in the population (p). • Note that for rare alleles even strong selection will not necessarily result in a rapid increase in an allele’s frequency.
Allele frequency change between generations • Alleles can differ greatly in their fitness. E.g. some alleles cause severe diseases and are strongly selected against. • Many alleles however differ only slightly in their average excess of fitness, but because the effect of the fitness difference compounds over time (just like interest on money) even small differences can result in big changes.
Allele frequency change between generations • The compounding effect of natural selection is more effective in large populations than small ones. • In small populations drift can easily eliminate beneficial mutations. In larger populations drift has less of an effect.
Natural selection more powerful in large populations • Effects of drift strong in small populations but weaker in large populations • Small advantages in fitness can lead to large changes over the long term in large popultions.
Relative fitness • Relative fitness can be expressed in different ways but often the genotype with the highest fitness is designated as having a relative fitness of w = 1. • Genotypes with lower relative fitness then have values for w of between 0 and 1.
Relative fitness • Another way differences in relative fitness are sometimes expressed by using a parameter (s) called the selectioncoefficient to describe the reduction in fitness of one genotype vs the other. • A genotype that has a 20% lower fitness than a competing one would have an s value of 0.2.
Strength of selection • Strength of selection has a strong influence on how fast an allele spreads. • In pocket mice coat color is affected by a gene with two alleles D and d. D allele is dominant. • DD: dark phenotype • Dd: dark phenotype • Dd: light phenotype • On dark backgrounds light phenotype will be selected against.
Strength of selection • The higher the value of s the more strongly natural selection acts.
Frequency independent selection • The mouse coat color example is an example of frequency-independent selection. The fitness of a trait is not associated with how common the trait is.
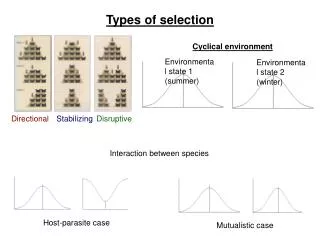
Directional selection • The commonest form of frequency- independent selection is directional selection. • Under directional selection one allele is consistently favored over the other allele so selection drives allele frequencies in only one direction towards a higher frequency of the favored allele. • Eventually favored allele may replace other alleles and become fixed.
Gene interactions • Whether an allele is dominant, recessive or has additive effects (is codominant) will have a strong influence on how fast it spreads in a population.
Relationships among alleles at a locus • Additive: allele yields twice the phenotypic effect when two copies present • Dominance: dominant allele masks presence of recessive in heterozygote • Recessive: two copies of recessive allele need to be present for alleles effect to be felt.
Empirical examples of allele frequency change under selection • Clavener and Clegg’s work on Drosophila. • Two alleles for ADH (alcohol dehydrogenase breaks down ethanol) ADHF and ADHS
Empirical examples of allele frequency change under selection • Two Drosophila populations maintained: one fed food spiked with ethanol, control fed unspiked food. • Populations maintained for multiple generations.
Empirical examples of allele frequency change under selection • Experimental population showed consistent long-term increase in frequency of ADHF • Flies with ADHF allele have higher fitness when ethanol present. • ADHF enzyme breaks down ethanol twice as fast as ADHS enzyme.
Empirical examples of allele frequency change under selection: Jaeken syndrome • Jaeken syndrome: patients severely disabled with skeletal deformities and inadequate liver function.
Jaeken syndrome • Autosomal recessive condition caused by loss-of-function mutation of gene PMM2 codes for enzyme phosphomannomutase. • Patients unable to join carbohydrates and proteins to make glycoproteins at a high enough rate. • Glycoproteins involved in movement of substances across cell membranes.
Jaeken syndrome • Many different loss-of-function mutations can cause Jaeken Syndrome. • Team of researchers led by Jaak Jaeken investigated whether different mutations differed in their severity. Used Hardy-Weinberg equilibrium to do so.
Jaeken syndrome • People with Jaeken syndrome are homozygous for the disease, but may be either homozygous or heterozygous for a given disease allele. • Different disease alleles should be in Hardy-Weinberg equilibrium.
Jaeken syndrome • Researchers studied 54 patients and identified most common mutation as R141H. • Dividing population into R141H and “other” alleles. Allele frequencies are: Other: 0.6 and R141H: 0.4.
Jaeken syndrome • If disease alleles are in H-W equilibrium then we would predict genotype frequencies of • Other/other: 0.36 • Other/R141H: 0.48 • R141H/R141H: 0.16
Jaeken syndrome • Observed frequencies are: Other/Other: 0.2 Other/R141H: 0.8 R141H/R141H : 0 Clearly population not in H-W equilibrium.