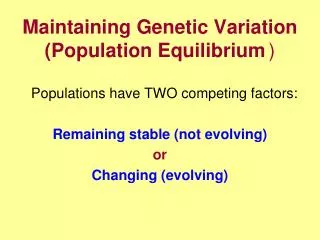
Genetic background and population stratification
460 likes | 656 Vues
Genetic background and population stratification. Shaun Purcell 1,2 & Pak Sham 1 1 Social, Genetic & Developmental Psychiatry Research Centre, IoP, KCL, London. 2 Whitehead Institute, MIT, Cambrdige, MA, USA. Association & stratification. Sewall Wright (1951)

Genetic background and population stratification
E N D
Presentation Transcript
Genetic background and population stratification Shaun Purcell1,2 & Pak Sham1 1Social, Genetic & Developmental Psychiatry Research Centre, IoP, KCL, London. 2Whitehead Institute, MIT, Cambrdige, MA, USA.
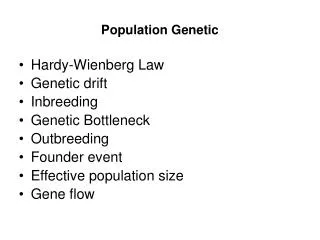
Association & stratification • Sewall Wright (1951) • concepts of population structure & impact on the evolutionary process • C. C. Li (1972) • impact of population structure on disease-gene association studies • increase in type I errors • decrease in power
Signatures of stratification • At a single locus • non-independence of paternal and maternal alleles • Across loci • non-independence of alleles across loci • linkage disequilibrium, LD • use LD to map genes • spuriously infer indirect association
At a single locus • Allele frequencies A1p A2 q • Genotype frequencies • expected under “Hardy-Weinberg equilibrium” A1A1 p2 A1A2 2pq A2A2 q2
At a single locus Sub-population 1 2 A1 0.1 0.9 A2 0.9 0.1 A1A1 0.01 0.81 A1A2 0.18 0.18 A2A2 0.81 0.01 1+2 0.5 0.5 0.41 (0.25) 0.18 (0.50) 0.41 (0.25)
Quantifying population structure • Expected average heterozygosity • in random mating subpopulation (HS) • in total population (HT) • from the previous example, • HS = 0.18 , HT = 0.5 • Wright’s fixation index • FST = ( HT - HS ) / HT • FST = 0.64 • 0.01 - 0.05 for European populations • 0.1 - 0.3 for most divergent populations
Across loci • 200 Scandinavians B1 B2 A1 160 160 2 = 0 A2 40 40 • 200 Spaniards B1 B2 A1 160 40 2 = 0 A2 160 40
Across loci • 400 Scandinavians and Spaniards combined B1 B2 A1 320 200 2 = 7.81 A2 200 80 • Spurious association • not reflective of genetic distance • A and B might be on different chromosomes
Solutions • Family controls • related individuals share same sub-population • e.g. TDT test, between-within model • Index of membership • self-reported ethnicity • not always accurate / effects may be subtle • infer from an individual’s genetic background • detection • look for signatures of population stratification • correction • correct tests for inferred substructure
Genetic background approaches • Genomic Control • Structured Association • Method: multilocus genotype data to detect and correct for stratification • Premise: stratification operates globally – on whole genome, whereas LD operates locally at short scales
Genomic control • 2 statistics not distributed as 2 under PS “overdispersion” • Pritchard & Rosenberg (1999) • assess whether 2 statistics for unlinked markers are okay • Devlin & Roeder (1999) • null locus test statistic TNdistributed 21 • in presence of stratification, TN / ~ 21 • estimate • statistic at test locus T / ~ 21
2 Stratification adjust test statistic Genomic control 2 No stratification Test locus Unlinked ‘null’ markers
Genomic control • Simple estimate of inflation factor • using the median protects from outliers • i.e. if some of the null markers are also QTL • bounded at minimum of 1 • i.e. should never increase test statistic • principle extended to multiple alleles, haplotpes, quantitative traits • Must formulate all tests as 1 df tests, however
Genomic control • Inflation factor R number of cases (controls) F Wright’s FST coefficient of inbreeding gk (fk) Proportion of cases (controls) from subpopulation k • Example • 2 equifrequent subpopulations, FST = 0.01 • Disease twice as common in one subpopulation • R = 1000 • 1.5
Structured association • Assignment of individuals to subpopulations • Test for association conditional on subpopulation • Distance-based approaches • Model-based approaches • Pritchard et al (2000) • Bayesian framework (STRUCTURE / STRAT) • Satten et al (2001) • Latent class analysis model • Purcell & Sham • Latent class analysis model (L-POP / L-ASSOC)
Structured association LD observed under stratification Unlinked ‘null’ markers Subpopulation A Subpopulation B
Advantages of SA • Structure of intrinsic interest • Any test of association can be used • Allows allelic heterogeneity between subpopulations • Does not assume constant FST across the genome
Structured association • Genotype a number of loci across the genome • Loci must be unlinked • in a non-stratified sample, would not expect to observe correlations between these loci • in a stratified sample, would not expect to observe correlations between these loci within sub-population
Latent Class Analysis • K sub-populations, latent classes • Sub-populations vary in allele frequencies • Random mating within subpopulation • Within each subpopulation • Hardy-Weinberg and linkage equilibrium • For population as a whole • Hardy-Weinberg and linkage disequilibrium
Latent Class Analysis • Goal : assign each individual to class C of K • Key : conditional independence of genotypes, G within classes P(C | G) posterior probabilities P(C) prior probabilities P(G | C) class-specific allele frequencies
E-M algorithm E step: counting individuals and alleles in classes P(C) -2LL P(C | G) P(G |C) Converged? M step: Bayes theorem, assume conditional independence
Assumes conditional independence Product over l = 1 to L loci M-step • For each individual, posterior probabilities Sum over j = 1 to K classes
Likelihood • Likelihood of an individual • Use AIC to select optimal K solution
Allowing for admixture • Stratification within a sample • we have assumed sub-populations are distinct • Admixture within an individual • an individual’s genome has descended from 2 or more pure sub-populations
Correction • Satten et al • Test of association combined with detection of structure • Binary disease traits • P(C|G) as covariates • K-1 covariates • Alternatively, assign to class with highest P(C|G) • Applicable to any type of analysis / trait • Can allow for interactions (i.e. different effects between subpopulations)
Class-specific likelihood of genotype conditional on trait Individual’s class probabilities (estimated using L-POP) Parameters p, a, d (potentially class-specific) Testing for association • Weighted likelihood • Model probability of genotype conditional on trait
Example #2 • 3 subpopulations, 1000 individuals, 30 SNPs • 70% : 20% : 10% • allele frequency U[0.001 - 0.999] + N(0, 0.2) AIC
Latent class Class 1 690 4 4 1 Class 2 212 1 88 Class 3 K= 3 Sub-population A B C
Notes on L-POP • Example parameter file (http://statgen.iop.kcl.ac.uk/lpop/) Example parameter file DATAFILE mydata.raw STRUCTURE PHENO 4 CLASS 2 TAG cl2 RAND 0 REPEAT 10 VERBOSE2 1st line is title required file format # cols to skip model specification Name tag for results Random # seed # attempts at convergece Verbosity of output (1-3)
Results format for L-POP grep P: results get prior class probabilities grep K: results get likelihood, AIC grep k: results get likelihood, AIC from all E-M convergences grep I: resultsget posterior class probabilties grep D: results get genetic distance matrix grep I:cl3: results get P(C|G) for solution with TAG cl3 only
Notes on L-ASSOC Data : Individuals only, quantitative trait .ped file and .dat file weights as covariates (C in .dat file) Parameters: used to build alt and null models Universal Class-specific Allele frequency: p P Additive genetic value: a A Dominance deviation: d D
Notes on L-ASSOC Standard test of association lassoc ––file data ––alt pa ––null p Test of association allowing for stratification lassoc ––file data ––alt Pa ––null P Test of allele frequency differences between strata lassoc ––file data ––alt P ––null p Test of QTL by strata interaction lassoc ––file data ––alt PA ––null Pa Test of all effects lassoc ––file data ––alt PAD ––null P
lassoc --file data --alt pa --null p Model SP p a d va vd -------------------------------------------------------- H1 1 0.498 0.020 0.005 2 0.498 0.020 0.005 3 0.498 0.020 0.005 HO 1 0.498 2 0.498 3 0.498 ---------------------------- -2LL(H1) 209.839 -2LL(H0) 216.029 LRT 6.190 df 1 p-value 0.013 ----------------------------
lassoc --file data --alt Pa --null P Model SP p a d va vd -------------------------------------------------------- H1 1 0.624 0.017 0.004 2 0.443 0.017 0.004 3 0.502 0.017 0.004 HO 1 0.622 2 0.446 3 0.508 ---------------------------- -2LL(H1) 209.839 -2LL(H0) 216.029 LRT 1.190 df 1 p-value 0.734 ----------------------------
Practical session • Goal • using QTDT, LPOP and LASSOC, analyse the data under the pshaun/strat/ directory • 1. For the two SNP test markers, what does standard association analysis reveal? • 2. Is there evidence for population substructure? • 3. What is the effect of testing for association conditional on any substructure, using family-based tests?
(I) Individuals QTDT dind.ped, dind.dat Collect siblings Type 50 null loci (II) Family-based analysis (III) GC / SA analysis QTDT dfam.ped, dfam.dat LPOP dnull.ped Generate weights (IV) SA (V) GC QTDT dcov.ped, dcov.dat LASSOC dnull.ped, dnull.dat LASSOC dcov.ped, dcov.dat
dfam.ped 1 3 0 0 1 -9 -9 -9 -9 -9 1 4 0 0 1 -9 -9 -9 -9 -9 1 1 3 4 1 1 1 1 2 1.576 1 2 3 4 1 1 2 1 2 1.576 “Parents” Siblings dnull.ped 1 1 0 0 1 1 1 1 2 1.576 1 1 1 2 2 1 2 2 1 2 2 1 … 2 1 0 0 1 1 2 1 1 0.368 1 2 1 1 2 1 2 2 2 1 2 1 … 3 1 0 0 1 2 1 1 1 -0.423 2 1 1 1 1 2 1 1 2 1 1 1 … PED details, QTL & trait Null markers dcov.ped 1 1 0 0 1 1 1 1 2 1.576 0.000 0.000 1.000 2 1 0 0 1 1 2 1 1 0.368 0.000 0.150 0.850 3 1 0 0 1 2 1 1 1 -0.423 0.998 0.001 0.001 Posterior probabilities (estimated by LPOP) Trait QTL PED details dind.ped 1 1 0 0 1 1 1 1 2 1.576 2 1 0 0 1 1 2 1 1 0.368 3 1 0 0 1 2 1 1 1 -0.423
Standard QTDT analysis (not controlling for stratification) qtdt –p dind.ped –d dind.dat -at -weg Family-based QTDT analysis (not controlling for stratification) qtdt –p dfam.ped –d dfam.dat -at –weg Family-based QTDT analysis (within test, controlling for stratification) qtdt –p dfam.ped –d dfam.dat -ao –weg Family-based QTDT analysis (test of stratification) qtdt –p dfam.ped –d dfam.dat -ap –weg L-POP stratification analysis lpop < param1 > results lpop < param2 >> results lpop < param3 >> results lpop < param4 >> results Get lowest AIC grep AIC results Get prior class probabilities for 3 class solution (TAG cl3) grep P:cl3: results Get posterior probabilities from the 3 class solution grep I:cl3: results grep I:cl3: results | gawk ‘{print $4,$5,$6}’ > postprob
QTDT analysis, using covariates qtdt –p dcov.ped –d dcov.dat -at -weg LASSOC analysis, not controlling lassoc --file dcov --alt pa --null p LASSOC analysis, controlling stratification lassoc --file dcov --alt Pa --null P LASSOC analysis, testing for stratification lassoc --file dcov --alt P --null p LASSOC analysis, allowing for QTL x strata interaction lassoc --file dcov --alt PA --null P LASSOC analysis of all null loci lassoc --file dnull --alt pa --null p Get median test statistic, divide by 0.456, use to correct QTL tests e.g. using grep to extract test statistics efficiently lassoc --file dnull --alt pa --null p > gcresults grep LRT gcresults