Download
1 / 32
320 likes | 400 Vues
Explore the potential of China and Mexico markets for U.S. exporters. Navigate challenges, understand trends, and leverage growth opportunities in trade relations between the U.S., China, and Mexico.

E N D
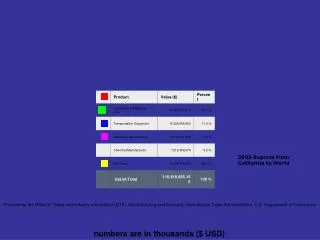
2005 Exports from California to World Provided by the Office of Trade and Industry Information (OTII), Manufacturing and Services, International Trade Administration, U.S. Department of Commerce. numbers are in thousands ($ USD)
China’s dynamic and growing market presents tremendous opportunities for U..S exporters… but China can be a challenging market in which to do business” • Secretary Gutierrez, U.S. Department of Commerce
The Other by Carlos Antonio Rovelo
The Other • Do you export to • China • Mexico • Have you visited • China • Mexico • Do you speak • Mandarin or Cantonese • Spanish • DO YOU HAVE A FRIEND IN CHINA OR MEXICO
U.S. buys 40 percent of China exports
The Other: China 2010 China’s exports are expected to double
manuFACTOR • 55 PERCENT OF GOODS PRODUCED IN CHINA ARE MADE BY U.S. MULTINATIONALS • MOST OF WHAT USED TO BE MADE SOMEWHERE ELSE IN ASIA IS NOW BEING MANUFACTURED IN CHINA
The Other • The century of the Other • The difficulty to understand the Other • Ethnocentric • You cannot be an educated business person unless you are open to the Other • Listen to the Other • Individuality is alive and well in America
China as a Market Share of World Consumption • Cement: 40% • Coal: 31% • Iron Ore: 30% • Steel: 27% • Aluminum: 25% • Oil: 8% and growing 30%/yr 2003 Data
2004 U.S. REGIONAL TRADE (Billions of U.S. Dollars) Canada Balance –67 Pacific 189 Atlantic 226 540 256 419 230 Balance –314 Balance – 189 Mexico 156 99 111 61 Balance – 45 South America and Caribbean Balance –38
Pacific trade move primarily from dominant seaports to inland port locations Prince Rupert, CN Vancouver, CN Seattle Tacoma NY/NJ Oakland LA/Long Beach Pacific Suez To U.S. East Coast Panama Canal to Gulf and East Coast Ports
Future Corridors Prince Rupert, CN Vancouver, CN Seattle Tacoma NY/NJ Oakland LA/Long Beach Pacific Suez To U.S. East Coast Manzanillo Panama Canal to Gulf and East Coast Ports New Routes Through Mexican Ports Acapulco
Mexico – China Exports to the USJanuary – February 2006 • Mexican exports to the U.S. rose 8.3%, down from an increase of 12.6% in the same period last year • China’s exports to the U.S. soared 18% over the same time period
China’s Electromechanical Exports January – September 2005 • $299.02 billion – a 32.9% increase • 54.7% of total value of China exports • Computer equipment and spare parts - $73.28 billion – an 27.2% increase • Household electrical appliances and electronic products - $37.9 billion – a 29.1 % increase • Communications equipment and components - $32.34 billion – an 43% increase • Electronic Components - $27.75 billion – a 34.7% increase • Electronic equipment - $18.23 billion – a 27.5% increase Source: China Knowledge
US-China Comparison US China Meat 37 67 Steel 104 258 Oil 20.4 6.5 * Coal 574 804 Fertilizer 19 41 Million Tons per year except Oil at million barrels/day * 30% annual increase
Mexico’s Silicon Valley Guadalajara In-bound processing (Maquiladora) Electronic components, supplies and Machinery $88 billion (2003) $91.3 billion (2004)
Aluminum Copper MEXICO
Guadalajara’s Initiative • Financial Incentives (high tech sector) • Distribution and Consolidation for technology trade • HP • Sanmina - SCI • IBM • Trade Zone • Communication: Rail, Trucking, Air, and the Port of Manzanillo (3 hrs from Guadalajara) • On going investment in Infrastructure – To Improve Competitiveness • Shanghai / Manzanillo Preferential Agreement • Cosco and China Shipping (Direct Shipping) • International Business Development Center (Incubator) • On going investment in Education – For Higher Value Added Production
Primary Goals • FOREIGN INVESTMENT - Attract foreign and trade-related businesses via financial incentives and amplifying Guadalajara’s international advantages. • TRADE DEVELOPMENT – Assist Guadalajara area businesses in expanding their international trade interests. • ADVOCACY - Enhance Guadalajara’s international trade infrastructure and position through advocacy and project development initiatives.
A View to the Future • SHORT TERM: • Development of New Freight Corridors = New Opportunities for Guadalajara • Logistics/Distribution • Value Added Activities • Triangulation of Trade China – Mexico – US • Growth in China = New Opportunities for Mexican/US Exporters • LONG TERM: • Attracting Foreign Investment from China • Manufacturing Costs will Rise in China = More FDI
It’s not the price stupid It is the margin
Some China Milestones • 2000 – largest refrigerator and TV market • 2002 - largest mobile phone market • 2010 – largest PC market • 2030 – largest economy on planet
Outline • TRENDS IN US, MEXICO & CHINA TRADE • GUADALAJARA’S INVESTMENT IN THE TECHNOLOGY SECTOR • LOOKING AHEAD