Download
1 / 14
140 likes | 277 Vues
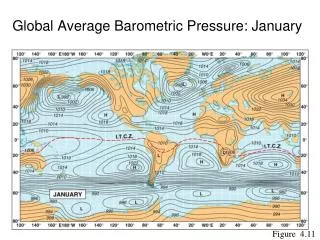
Global Average Barometric Pressure: January. Figure 4.11. Global Average Barometric Pressure: July. Figure 4.11. Primary High Pressure & Low Pressure Areas. Equatorial low pressure zone : (aka Intertropical Convergence Zone) band of cloudiness & abundant precipitation. Thermally induced

E N D
Global Average Barometric Pressure: January Figure 4.11
Global Average Barometric Pressure: July Figure 4.11
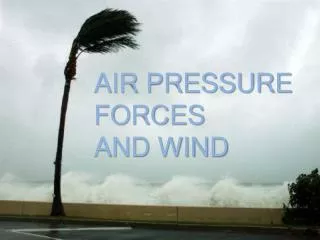
Primary High Pressure & Low Pressure Areas • Equatorial low pressure zone: (aka Intertropical Convergence Zone) band of cloudiness & abundant precipitation. Thermally induced • Polar high pressure cells: subsiding air, stronger in winter. When strong, are associated with minimal precipitation. Thermally induced • Subtropical high pressure cells: areas of subsiding air, dry climates when on west side of continents. Dynamically induced • Subpolar low pressure cells: mean locations are Iceland & Aleutian Islands. Cause winter precip. (mid-latitude cyclones) Dynamically induced • All of above pressure cells move north and south in response to seasonal changes in the subsolar point. Same w/ wind systems.
OPTIONAL Comparing July & January Isobar Maps, Northern Hemisphere • Remember that maps are of average pressures, so they just show general tendencies • Aleutian Low not evident in July (but it is a weak feature) • High pressure cells are more developed (have more isobars) over oceans in July • High pressure cells are located farther north in July (both location and strength driven by land-sea temperature difference, with land warming in summer) • Note presence of continental high pressure over N Asia and North America in January (thermal highs)
Other pressure cell terms • Doldrums • Horse Latitudes
Primary Wind Systems • Trade Winds: most constant of all wind systems. Zone also source region for tropical storms and hurricanes. • Westerlies: intensity positively related to Equator-Polar temperature differences. What season are they strongest? Which hemisphere the most persistent? • Polar Easterlies: velocity related to strength of polar high; stronger in winter • Polar Front: (not a wind) boundary where polar easterlies and the westerlies converge, bad weather zone • Actual global wind circulation is modified by the effects of continents and their different levels of heating and cooling as compared with the oceans
General Atmospheric Circulation: This is similar to your model to know! Figure 4.13
Upper Atmospheric Circulation • Jet Stream: the core of upper-level westerly geostrophic winds, generally of high velocity. • Rossby Waves are found in the upper-air westerly circulation of middle and high latitudes. See “Jet Streams” slide below.
Cross Section of General Atmospheric Circulation Figure 4.13
Jet Streams Figure 4.17
Local Winds • defined
Monsoonal Wind Systems • Seasonal wind changes that happen at a regional/continental scale due to seasonal reversals of onshore-offshore temperature differences. • Summer: onshore circulations, rain! • Winter: offshore circulations, dry • Where? S & SE Asia, Eq. Africa, a bit of S. America