Download
1 / 46
460 likes | 601 Vues
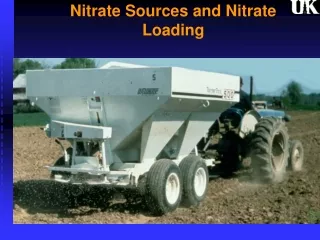
Salt and Nitrate Sources Pilot Implementation Study Report Summary. Central Valley Salinity Coalition. March 11, 2010. Larry Walker Associates Systech Water Resources, Inc. Luhdorff & Scalmanini Consulting Engineers NewFields Agricultural and Environmental Resources. Study Report Sections.

E N D
Salt and Nitrate Sources Pilot Implementation Study ReportSummary Central Valley Salinity Coalition March 11, 2010 Larry Walker Associates Systech Water Resources, Inc. Luhdorff & Scalmanini Consulting Engineers NewFields Agricultural and Environmental Resources
Study Report Sections • Executive Summary • 1 – Introduction • 2– Study Methodology Overview • 3 – Data Collection and Analysis Methods • 4 – Pilot Study Results (Summary) • 5 – Conclusions, Discussion, and Recommendations • 6 – References • Attachments
Study Report Attachments • Attachment 1 – WARMF Model Description • Attachment 2 – Groundwater Model Description • Attachment 3 – Pilot Study Area Descriptions • Attachment 4 – Yolo Study Area Catchment Results • Attachment 5 – Modesto Study Area Catchment Results • Attachment 6 – Tule R. Study Area Catchment Results • Attachment 7 – Yolo Area Time Series Plots • Attachment 8 – Irrigation, Fertilizer, and Salinity Loading Rates • Attachment 9 – List of Acronyms and Abbreviations • Attachment 10 – Data Sources Status Summary • Attachment 11 – Responses to Comments on Final Draft Report
Specific Study Objectives • Define salt and nutrient sources of significance. • Provide methods and manner of collection, characterization, and use of the salt and nutrient source data for the pilot areas. • Outline data currently available and the quality of the data. • ID additional data that should be collected or developed. • Indicate how methodology accounts for total salt loading balance and accumulation and ID critical concentration discharges.
Specific Study Objectives • Ensure accurate accounting of all sources. • ID how historic, current, and future source quantities will be determined or estimated to provide trend information. • ID and quantify areas where NO3 impacting beneficial uses of waters. • Select analytical tools and methods that work for the pilot areas as well as other parts of the Central Valley.
Define Constituents of Concern (TDS and Nitrate + Chloride example) Identify Potentially Significant Salt and Nitrate Sources Select Tools for Analysis Identify Data Needs for Tools Study Methodology – Preparatory Tasks Identify Data Sources
Select Pilot Study Areas Collect, Assess, and Input Data into Analysis Tools Perform Preliminary Analysis and Data Validation Perform Final Analysis and Produce Study Results Study Methodology – Primary Tasks Develop Conclusions and Recommendations
Study Tools • WARMF Model • Groundwater Models • Yolo – CVHM (USGS, 2009) • Modesto – MODFLOW Model (USGS, 2007) • Tule River – MODFLOW model (Harter) • Particle tracking MODPATH
Summary of Data Needs N = Necessary E = Typ. Estimated
Summary of Data Needs M = Model Value
WARMF Model Input/Output Flowchart Surface Hydrology WatershedProcesses Land CoverParameters Topography Meteorology WARMF Database Surface System Salt & Nitrate Mass Balance Water Quality Groundwater Recharge and Pumpage Salt & Nitrate Source Load Accounting WARMFSensitivity and Validation Analysis Near-surface Groundwater Salt & Nitrate Mass Balance Refined WARMFAnalysis GroundwaterFlow Modeling Deeper Groundwater Salt & Nitrate Quality GroundwaterQuality Modeling
Pilot Area Selection Criteria • Major Central Valley hydrologic basins represented (Sacramento River, San Joaquin River, and Tulare Lake) • Advanced application status of WARMF model for the area (previously applied, partially applied, or not currently) • Range of land use classes (including various urban, industrial, commercial, and agricultural) • Relatively advanced status of GW flow models applied • Available GW quality data
Selected Pilot Areas • Yolo - Active CVHM area Cache-Putah Subbasins- Mix of urban, rural, ag- Mix of SW & GW supplies • Modesto • - Parts of Modesto, Turlock, & Delta Mendota Subbasins- Urban with food processing, rural, ag- Mix of SW & GW supplies • Tule River- Entire Tule Subbasin, also parts of Tulare Lake and Kaweah Subbasins - Mostly ag land, some urban- Mix of SW & GW supplies
Mass Balance Calculation Elements Inflows Atmospheric Deposition PointSources LandApplication Diversion Irrigation Uptake Surface Water Near-surface Groundwater Lateral Flow Outflows Reactions Rxns Recharge Municipal Pumping Irrigation Pumping Deeper Groundwater
Mass Balance – Surface Water TDS Input Inflows fromUpstream42% Inflows fromUpstream53% Imported Water39% Inflows fromUpstream81% Imported Water49% Output Diversion17% Diversion23% Outflow toDownstream38% Outflow toDownstream71% Diversion61% Outflow toDownstream77%
Near-Surface GW Loading to Surface Water by Land Use Class – Modesto 1. Top 11 land use sources
Mass Balance – Near-Surface Groundwater TDS Input Fertilizer/Land App35% Irrigation32% Fertilizer/Land App47% Irrigation72% Irrigation44% Output Net Plant Uptake/ Rxn Decay51% Recharge toDeeper GW47% Rechargeto Deeper GW56% Outflow toSurface Water24% Rechargeto Deeper GW72%
Mass Balance – Deeper GW TDS Input Recharge fromNear-surface GW100% Recharge fromNear-surface GW100% Recharge fromNear-surface GW100% Output Pumping forIrrigation100% Pumping forIrrigation95% Pumping forMun/Ind81%
Mass Balance – Surface Water Nitrate Input Inflowsfrom Near-surface GW45% Inflowsfrom Upstream51% Inflowsfrom Upstream63% Imported Water46% Output Diversion17% Diversion19% Diversion44% Outflow toDownstream56% Outflow toDownstream83% Outflow toDownstream80%
Mass Balance – Near-Surface GW Nitrate Input Mineral weathering/Rxn product29% Fertilizer/Land App83% Fertilizer/Land App63% Fertilizer/Land App54% Output Net Plant Uptake/ Rxn Decay36% Rechargeto Deeper GW 32% Net Plant Uptake/ Rxn Decay56% Rechargeto Deeper GW57% Net Plant Uptake/ Rxn Decay84%
Mass Balance – Deeper GW Nitrate Input Recharge fromNear-surface GW100% Recharge fromNear-surface GW100% Recharge fromNear-surface GW100% Output Pumping forIrrigation95% Pumping forMunicipal/Industrial84% Pumping forIrrigation100%
Mass Balance Summary – TDS • Principal TDS inputs to near-surface GW: irrigation and fertilizer/land application • Other sources contributing >10 percent TDS to near-surface GW: • Yolo and Modesto - atmospheric deposition • Tule River - mineral weathering and reaction products • TDS is accumulating in the near-surface and deeper GW in all three pilot areas.
Mass Balance Summary – Nitrate • Principal NO3 inputs to near-surface GW: irrigation and fertilizer/land application. • Other sources contributing >10 percent NO3 to near-surface GW: • Yolo and Tule River - mineral weathering and reaction products • NO3 accumulating in near-surface GW all three pilot areas and in the deeper GW in the Yolo and Modesto areas, but depleting in Tule River area as a whole.
Conclusions – Key Project Objectives Objective 4: Identify additional data that should be collected or developed. Data collected during study: Adequate to run models and perform mass balance calculations. Additional data: Likely to improve certainty and accuracy of results.
Conclusions – Key Project Objectives Objective 9: Select analytical tools and methods that work for the pilot areas as well as other parts of the Central Valley. Analytical tools and methods for study: Are applicable to all parts of the Central Valley. Primary data for mass balance calculation model: Required meteorologic, hydrologic, and land cover data (readily available for all regions). Other required data: Typically can be estimated.
Conclusions – Key Project Objectives Overall: ID/assemble input data for available models, then use the models to quantitatively relate salt and nitrate sources and sinks within representative pilot study areas. WARMF output: Demonstrates use as accounting method for tracking salts and NO3 on and beneath the land surface. GW models: Demonstrate how these provide complementary data to WARMF model application and insights regarding subsurface distribution of salts and NO3 in GW.
Study Recommendations – Land Cover Refine handling of non-Dairy CAFO’s. Refine land use classes for mixed or blended classes of crops (e.g. other row crops). Aggregate land use class with small percentages of total land use and loading where possible. Refine nitrogen loading parameters for dairy solids to include N forms. Perform sensitivity analyses for soil classes and parameters and refine, if appropriate, using SSURGO mapping and parameters. Compare estimated fertilizer application with fertilizer sales/use data.
Recommendations – Surface Water Perform post-WARMF analyses to quantify salt and NO3 loadings to near-surface GW by land use class to better identify land use classes with the highest potential to impact GW. Perform a more extensive set of sensitivity analyses to better define the relative importance of major input and process parameters. Establish single point of contact on RWQCB staff for processing requests for discharger data related to salt and nutrient planning efforts. Expand CIWQS public access database to include basic discharge data: flow, effluent quality, location, land discharge area.
Recommendations – GW Data and Modeling ID construction of CDPH wells to improve utility of historical WQ records. Add monitoring locations in under-sampled areas. Refine GW transport modeling to better account for N, salt, and recharge inputs and effects due to pumping. WARMF output to GW – disaggregate to individual land unit scale, then use as input to GW model for improved simulation of source distribution. Perform additional sensitivity analyses and recalibrate gw models as necessary. Consider use of both head and groundwater age data.
Recommendations – Other Analysis Tools Evaluate water, salt, and nitrate balances with whole-systems approach (current and future scenarios) Evaluate potential effects of future mass loadings on watersheds Recognize limitations of tools and data sets Evaluate sensitivity of tools to inputs and assumptions
Trend Analysis: NO3-NTule (MODPATH) Source Concentration (here: measured GW data) Nitrate concentration in the source zone (near water table and areas impacted within 50 years at specified depth below water table. Note: Groundwater nitrate data averaged and extrapolated across large sub-watersheds. Very coarse-scale approximation. WARMF Model Download URL: ftp://systechwater.comusername: cvsaltspassword: nitrate Questions – Contact: Joel Herr Systech Water Resources, Inc. joel@systechwater.com
Trend Analysis: NO3-NTule (MODPATH) Source Concentration (here: measured GW data) Nitrate concentration in the source zone (near water table and areas impacted within 50 years at specified depth below water table. Note: Groundwater nitrate data averaged and extrapolated across large sub-watersheds. Very coarse-scale approximation. Questions?