Download
1 / 15
160 likes | 407 Vues
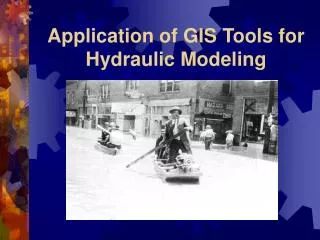
Application of GIS for Emission Inventory. HATHAIRATANA GARIVAIT and SIRAPONG SOOKTAWEE Environmental Research and Training Center, Thailand. xxx (Ton). xxx (Ton). xxx (Ton). xxx (Ton). emission (Ton). Assumption, Relation. Top-Down Method. SO 2 Emission plot by landuse 2003.

E N D
Application of GIS for Emission Inventory HATHAIRATANA GARIVAIT and SIRAPONG SOOKTAWEE Environmental Research and Training Center, Thailand
xxx (Ton) xxx (Ton) xxx (Ton) xxx (Ton) emission (Ton) Assumption, Relation Top-Down Method
OVERVIEW OF THIS APPLICATION Calculate total emission from economic sectors • Calculate total emission form fuel consumption • Thailand fuel consumption data are available at Department of Alternative Energy Development and Efficienccy (www.dede.go.th) GIS map preparation ArcGIS software are available at www.esri.com. In this study use ArcGIS v.9.0 Thailand digital map (scale 1: 50,000) of difference provinces is availible at Land Development Department website (www.ldd.go.th)
xxx (Ton) xxx (Ton) xxx (Ton) xxx (Ton) emission (Ton) Assumption, Relation
Total SO2 Emission of The Year 2003 * Total Area Emission = Total Emission – Power Generation
Landuse • A = Agriculture • U = Urban • I = Industrial • F = Forest • W = Water • M = Miscellaneous * We assumed no SO2 emission from forest, water and miscellaneous.
Landuse Emission by Economic Sector Total emission In ArcGIS (ton-SO2) in each landuse category Industrial (I) Manufacturing = 209,572.56 209,871.83 Mining = 299.27 Urban (R) Residential & = 3,878.55 5,410.51 Commercial Construction = 1,531.96 Agriculture (A) Agriculture = 2,071.18 2,071.18
Road • R = Road • N = No Road Road in Emission by Economic Sector Total emission ArcGIS (ton-SO2) Road (R) Transportation = 50,483.28 50,483.28
Point Source Emission of Power Generation = 70,244.54 Ton-SO2
SO2 Emission plot by landuse 2003 Total emission = 338,040.16 ton SO2
Exercise SO2 Emission Inventory in Thailand 2003 By Top-Down Approch
THANK YOU Thank You