Download
1 / 48
500 likes | 745 Vues
Johannes.Flemming@ecmwf.int contributions from Antje Innes, Johannes Kaiser, Jean-Jacques Morcrette, Vincent Huijnen (KNMI) & Martin Schulz (FZJ). Modelling and Assimilation of Atmospheric Chemistry. Overview. Motivation / MACC Basic concepts of atmospheric chemistry modelling Chemistry

E N D
Johannes.Flemming@ecmwf.int contributions from Antje Innes, Johannes Kaiser, Jean-Jacques Morcrette, Vincent Huijnen (KNMI) & Martin Schulz (FZJ) Modelling and Assimilation of Atmospheric Chemistry
Overview • Motivation / MACC • Basic concepts of atmospheric chemistry modelling • Chemistry • Emissions • Emissions vs. forecast initialisation (Data assimilation) • Russian Fires 2010 • SO2 from volcanic eruptions
Why Atmospheric Composition at NWP centres? • Environmental concern • Air pollution • Ozone hole • Climate change • Expertise in data assimilation of satellite, profile and surface obs. • Best meteorological data for chemical transport modelling • Interaction between trace gases & aerosol and NWP • radiation triggered heating and cooling • precipitation and clouds (condensation nuclei, lifetime …) • Satellite data retrievals improved with information on aerosol • Hydrocarbon (Methane) oxidation is water vapour source
Atmospheric Composition at ECMWF • Operational NWP • Climatologies for aerosol, green house gases ozone + methane • Ozone with linearized stratospheric chemistry and assimilation of ozone (TC) • GMES Atmospheric Service development (GEMS / MACC/ MACC II ) • 2005 – 2014 … (“Atmospheric Composition” division at ECMWF since 2012 !!) • aerosol and global-reactive-gases modules in IFS • Data assimilation of AOD and trace gases (ozone, CO, SO2, NO2, HCHO, CO2 CH4) retrievals (TC) with IFS 4D-VAR • Near-real-time Forecast and re-analysis of GRG, GHG and Aerosol
MACC Daily (NRT) Service Provision Air quality Global Pollution UV index Fires Aerosol
MACC Service Provision (retrospective) Reanalysis 2003-2010 Flux Inversions Ozone records
Impact of Aerosol Climatology on NWP Change in Aerosol Optical Thickness Climatologies New: reduction in Saharan sand dust Thickness at 550nm 26r1: Old aerosol (Tanre et al. 84 annually fixed) Old aerosol dominated by Saharan sand dust & increased sand dust over Horn of Africa J.-J. Morcrette A. Tompkins 26r3: New aerosol (June) Tegen et. al 1997 997):
Impact of Aerosol Climatology on NWP Surface Sensible heat flux differences old 20 W m-2 ~ 20-30% new New-old Boundary layer height increases >1km
Improved Predictability with improved Aerosol Climatology Figure 3: Average anomaly correlation coefficients (see main text for details) for forecasts of meridional wind variations at 700 hPa with the `old' (solid) and the `new' (dashed) aerosol climatology for (a) the African easterly jet region (15oW.35oE, 5oN.20oN) and (b) the eastern tropical Atlantic (40oW.15oW, 5oN.20oN). Forecast lead-times for which the score with the `new' aerosol is significantly better (at the 5% level) are marked with circles. Results are based on the weather forecasts (see main text for details) started at 12 UTCon each day between 26 June to 26 July 2004. Rodwell and Jung Published in Quart. J. Roy. Meteorol. Soc., 134, 1479.1497 (2008)
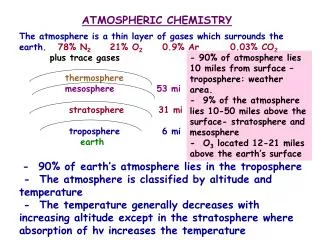
CH3OOH 700 H2 500 H2O2 500 N2 78% Ethane 500 CO2 380 NH3 400 310 N2O HCHO 300 HNO3 300 Ne 200 SO2 O2 CO 100 100 NOx 20% He (5) 18 others CH4 (1.8) Ozone 1% 30 H2OArgon ppb 1:109 ppt 1:1012 ppm 1:106 Atmospheric Composition – global average • The small concentrations do matter because • chemical conversion is non-linear • small concentrations could mean high turn-over, i.e. high reactivity
Remote sensing of trace gases Spectral ranges • Radiation absorbed or emitted from trace gases and aerosols are measured by satellites instruments: • The radiance information has to be converted into concentrations / total burdens in a process call retrieval(More in Angela’s lecture on observations operatorestomorrow)
A. Richter, Optical Remote Sensing WS 2004/2005 Wavelength Ranges in Remote Sensing UV:gas absorptions + profile information aerosols vis: surface information (vegetation) gas absorptions aerosol information IR: temperature information cloud information water / ice distinction many absorptions / emissions + profile information MW: no problems with clouds ice / water contrast surfaces some emissions + profile information
A. Richter, Optical Remote Sensing WS 2004/2005 SCIAMACHY and GOME-2: Target Species OH
Exciting satellite observations SO2, IASI, Univ. of Brussels/ EUMETSAT SO2, GOME-2, SACS, BIRA/DLR/EUMETSAT NO2, OMI, KNMI/NASA Aerosol Optical Depth, MODIS, NASA
Total ozone observations Satellite observations of atmospheric composition are getting better in terms of accuracy and spatial resolution.
Sentinel-4 Sentinel-5 Sentinel-5 Precursor Expected primary satellite provision for measuring atmospheric composition – Reactive gases
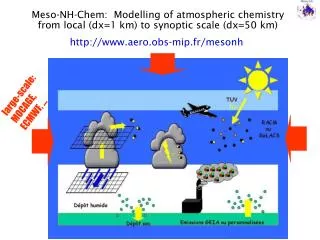
Modelling of Atmospheric CompositionTransport, Emissions, Deposition Chemical conversion
Atmospheric Reservoir Processes on Atmospheric Composition Chemical Reactions Photolysis Transport Transport catalytic Cycles Emissions wet & dry Deposition Dr. Martin Schultz - Max-Planck-Institut für Meteorologie, Hamburg
Modelling of Atmospheric Composition • Mass balance equation for chemical species ( up to 150 in state-of-the-art Chemical Transport Models) Transport Source and Sinks - not included in NWP
Integration of chemistry & aerosol modules in ECMWF’s integrated forecast system (IFS) C-IFS On-line Integration of Chemistry in IFS Coupled System IFS- MOZART3 / TM5 Developed in GEMS Used in MACC Developed in MACC 10 x more efficient than Coupled System Flemming et al. 2009
Nitrogen Oxides - sources and sinks MOZART-3 CTM 2003070500 Surface Emissions Total Columns Concentrations Note: High Loss is related to high concentrations Vincent Huijnen, KNMI Chemical Production and Loss & Lightning
Tropospheric Ozone - sinks and sources TM5 Chemical transport model 2003070500 No ozone emissions Total Columns Concentration Note: Strong night/day differences in chemical activity Chemical Production and Loss Vincent Huijnen, KNMI
Atmospheric Chemistry • Under atmospheric conditions (p and T) but no sunlight atmospheric chemistry of the gas phase would be slow • Sun radiation (UV) splits (photolysis) even very stable molecules such as O2 (but also ozone or NO2) in to very reactive molecules • These fast reacting molecules are called radicals and the most prominent examples are • O mainly in stratosphere and above, but also in troposphere • OH (Hydroxyl radical) and HO2 (peroxy radical) in troposphere • Reaction with OH is the most important loss mechanism in the troposphere for very common species such as CO , NO2, ozone and hydrocarbons • Chemical Mechanisms typically contain 50- 100 species and 2---300 chemical reactions
Chemical Lifetime vs. Spatial Scale ◄ into stratosphere No transport modelled
Emission Types • Combustion related (CO, NOx, SO2, VOC): • fossil fuel combustion • biofuel combustion • vegetation fires (man-made and wild fires) • volcanic emissions • Release without combustion (VOC, Methan): • biogenic emissions (plants and soils) • agricultural emissions (incl. fertilisation) • Wind blown dust and sea salt (from spray)
CO emissions from anthropogenic sources Example emissions inventory after gridding
Emissions variability Biomass burning C GFEDV3 and GFASv1.0 South America Anthropogenic CO MACCity Western Europe J. Kaiser C. Granier
Emission estimates, modelling and „obs“ • Emissions are one of the major uncertainties in modeling • The compilation of emissions inventories is a labor -intensive task based on a wide variety of socio-economic and land use data • Some emissions can be “modeled” based on wind (sea salt aerosol) or temperature (biogenic emissions) • Some emissions can be observed indirectly in near real time from satellites instruments (Fire radiative power, burnt area, volcanic plumes) • Several attempts have been made to correct emission estimates based on observations and using „inverse“ methods also used in data assimilation – in particular for long lived gases such as CO2 and Methane
Biomass Burning (vegetation fires) • Accounts for ~ 30% of total CO and NOx emissions, ~10% CH4 • Vegetation fires occur episodically and exhibit a large inter-annual variability. • Classic „climatological“ approach: use forest fire statistic • Emission data based on satellite observation • New approach: Use satellite observations of burned areas size • Newer approach: satellite observation (SEVIRI) of Fire Radiative Power to account for area burnt * fuel load • Increased variability • Still high uncertainty for estimates of burnt fuel and related emissions
Fire Radiative Power area burnt combustionefficiency fuelload emissionfactor Global Wildfire Emission Modelling J. Hoelzemann Burnt Area from Satellite Biomass amount Emissions CO
Improving Forecast:Emissions modelling/observations vs.Initialisation with Analyses (Data Assimilation) Russian Fires Volcanic Erruptions
Atmospheric Composition data assimilation vs. Numerical Weather Prediction assimilation • Quality of NWP depends predominantly on initial state • AC modelling depends on initial state (lifetime) and surface fluxes (Emissions) • CTM have large biases than NWP models • Only a few species (out of 100+) can be observed • AC Satellite retrievals • Little or no vertical information from satellite observations • Fixed overpass times and day light conditions only (UV-VIS) • Retrievals errors can be large • AC in-situ observations • Sparse (in particular profiles) • limited or unknown spatial representativeness
Russian Fires 2010 Moscow Source: wikipedia
NRT Fires emissions • Fire emissions is inferred from MODIS and SEVIRI Fire Radiative Power (FRP) • FRP allows NRT estimate of fire emissions • NRT fire emission improve AQ forecast
Russian Fires – Model Simulation • Model run with climatological emissions – no assimilation (CNT) • Model run with observed emissions (FRP) - no assimilation (GFAS) • Model run initialised with analyses – climatological emissions (ASSIM) • Model run initialised with analyses and observed emissions (ASSIM-GFAS) Huijnen et al, 2011
Russian Fires 2010 MOPITT OBS CNT (Climatological emissions) FRP fire emissions GFAS + Assimiliation
Russion Fires: Forecast CO vs observations Total Column Surface
Grimsvoetn eruption 2011 – SO2 forecasts • SO2 has shown to be a good proxi for volcanic ash (Thomas and Prata, 2011) • Estimates of SO2 source strength and emission height based on UV-VIS observations • Assimilation of GOME-2 SO2 retrievals for inialisiation • The forecasts: • EMI (only with emission estimate) • INI (only with initialisation) • INI&EMI (initialisation and
Analysis of TCSO2 using a log-normal and a normal background error covariance model Volcanic eruptions plumes are rare and extreme events. It is therefore difficult to correctly prescribe the background error statistics. Special screening is needed to correctly identify the plume from erroneous pixels. Plume height information was needed to determine the vertical structure of the back-ground error covariance (BGEC
Plume strength and height information • Release test tracer at different levels – find best match in position • Scale emissions of test tracer to observation to get emission estimate
Plume forecast evaluation • Check plume position and strength with thresholds (5 DU) • “hit rate” • “false alarm rate” • Check plume extend and strength without considering overlap • 99-Percentile • Plume size (> 5 DU)
Summary • Atmospheric composition and weather interact • Sound modelling of atmospheric chemistry needs to include many species with concentrations varying over several orders of magnitude • Atmospheric Composition forecast benefit from realistic initial conditions (data assimilation) but likewise from improved emissions • MACC system produces useful forecast and analyses of atmospheric composition • Showed Russian Fire Example and SO2Volcanos • NRT forecast and Re-analysis of Ozone, CO and Aerosol (2003-2008) are available at http://www.gmes-atmosphere.eu/ • More on AC Data assimilation of AC in Antje’s talk “Environmental Monitoring” and Angela’s talks “Observation Operators”