Download
1 / 39
410 likes | 579 Vues
Johannes.Flemming@ecmwf.int. Modelling and Assimilation of Atmospheric Composition Part I. Overview of lecture. Motivation / MACC Basic concepts of atmospheric chemistry modelling Chemistry Emissions Emissions vs. forecast initialisation (Data assimilation) Russian Fires 2010

E N D
Johannes.Flemming@ecmwf.int Modelling and Assimilation of Atmospheric CompositionPart I
Overview of lecture • Motivation / MACC • Basic concepts of atmospheric chemistry modelling • Chemistry • Emissions • Emissions vs. forecast initialisation (Data assimilation) • Russian Fires 2010 • SO2 from volcanic eruptions
Why Atmospheric Composition at NWP centres? • Environmental concern • Expertise in data assimilation and atmospheric modelling • Interaction atmospheric composition and NWP • Radiation triggered heating and cooling • Precipitation and clouds • Satellite data observations influenced by aerosols • Hydrocarbon (Methane) oxidation is water vapour source
Atmospheric Composition at ECMWF • Operational NWP • Climatologies for aerosol, green house gases ozone + methane • Ozone with linearized stratospheric chemistry and assimilation of ozone (TC) • GMES Atmospheric Service development ( MACC II ) • 2005 – 2014 … (“Atmospheric Composition” division at ECMWF since 2012 !!) • aerosol and global-reactive-gases modules in IFS • Data assimilation of AOD and trace gases (ozone, CO, SO2, NO2, HCHO, CO2 & CH4) retrievals with IFS 4D-VAR • Near-real-time forecast and re-analysis (2003-2012) of atmospheric composition
MACC Daily (NRT) Service Provision Air quality Global Pollution UV index Fires Aerosol
MACC Service Provision (retrospective) Reanalysis 2003-2010 Flux Inversions Ozone records
Impact of Aerosol Climatology on NWP Change in Aerosol Optical Thickness Climatologies New: reduction in Saharan sand dust Thickness at 550nm 26r1: Old aerosol (Tanre et al. 84 annually fixed) Old aerosol dominated by Saharan sand dust & increased sand dust over Horn of Africa J.-J. Morcrette A. Tompkins 26r3: New aerosol (June) Tegen et. al 1997 997):
Surface Sensible heat flux differences Impact of Aerosol Climatology on NWP old 20 W m-2 ~ 20-30% new New-old Boundary layer height increases >1km
Improved Predictability with improved Aerosol Climatology Figure 3: Average anomaly correlation coefficients (see main text for details) for forecasts of meridional wind variations at 700 hPa with the `old' (solid) and the `new' (dashed) aerosol climatology for (a) the African easterly jet region (15oW.35oE, 5oN.20oN) and (b) the eastern tropical Atlantic (40oW.15oW, 5oN.20oN). Forecast lead-times for which the score with the `new' aerosol is significantly better (at the 5% level) are marked with circles. Results are based on the weather forecasts (see main text for details) started at 12 UTC on each day between 26 June to 26 July 2004. Rodwell and Jung Published in Quart. J. Roy. Meteorol. Soc., 134, 1479.1497 (2008)
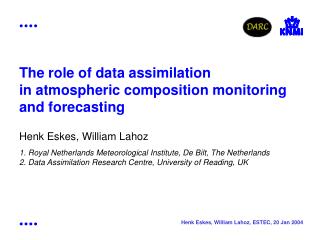
CH3OOH 700 H2 500 H2O2 500 N2 78% Ethane 500 CO2 380 NH3 400 310 N2O HCHO 300 HNO3 300 Ne 200 SO2 O2 CO 100 100 NOx 20% He (5) 18 others CH4 (1.8) Ozone 1% 30 H2OArgon ppb 1:109 ppt 1:1012 ppm 1:106 Atmospheric Composition – global averages • The small concentrations do matter because • chemical conversion is non-linear • small concentrations could mean high turn-over, i.e. high reactivity
Atmospheric Chemistry Modelling • Without sunlight atmospheric chemistry would be slow • Sun radiation (UV) splits (photolysis) stable molecules ( O2 ,O3 … NO2 ) in to very reactive molecules = radicals • The most prominent radicals examples are • O mainly in stratosphere and above • OH (Hydroxyl radical) and HO2 (peroxy radical) in troposphere • Reaction with OH is the most important loss mechanism in the troposphere for many species (CO , NO2, ozone, methane) • Chemical Mechanisms in models typically contain 50- 100 species and 200--300 chemical reactions • The chemistry/ aerosol scheme in IFS increases run time by a factor 2 - 10
Chemical Lifetime vs. Spatial Scale ◄ into stratosphere No transport modelled
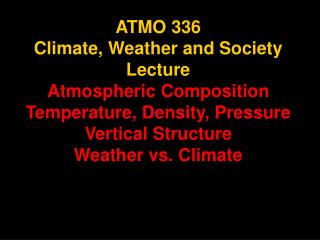
Atmospheric Reservoir Processes on Atmospheric Composition Chemical Reactions Photolysis Transport Transport catalytic Cycles Emissions wet & dry Deposition Dr. Martin Schultz - Max-Planck-Institut für Meteorologie, Hamburg
Modelling of Atmospheric Composition • Mass balance equation for chemical species ( up to 150 in state-of-the-art Chemical Transport Models) Transport Source and Sinks - not included in NWP
Integration of chemistry & aerosol modules in ECMWF’s integrated forecast system (IFS) C-IFS On-line Integration of Chemistry in IFS Coupled System IFS- MOZART3 / TM5 Developed in GEMS Used in MACC Developed in MACC 10 x more efficient than Coupled System Flemming et al. 2009
Emission Processes • Combustion related (CO, NOx, SO2, VOC, CO2) • fossil fuel combustion • biofuel combustion • vegetation fires (man-made and wild fires) • Fluxes from biogeochemical processes (VOC, Methane, CO2, Pollen): • biogenic emissions (plants, soils oceans) • agricultural emissions (incl. fertilisation) • Fluxes from wind blown dust and sea salt (from spray) • Volcanic emissions (ash, SO2, HBr …)
Emission Estimates • Emissions are one of the major uncertainties in modeling • The compilation of emissions inventories is a labor -intensive task based on a wide variety of socio-economic and land use data • Some emissions can be “modeled” based on wind (sea salt aerosol) or temperature (biogenic emissions) • Some emissions can be observed indirectly from satellites instruments (Fire radiative power, burnt area, volcanic plumes) • „inverse“ methods also used in data assimilation can be used to correct emission estimates using observations and models – in particular for long lived gases such as CO2 and Methane
Biomass Burning (vegetation fires) • Accounts for ~ 30% of total CO and NOx emissions, ~10% CH4 • Vegetation fires occur episodically and exhibit a large inter-annual variability. • Classic „climatological“ approach: use forest fire statistic • Emission data based on satellite observation • New approach: Use satellite observations of burned areas size • Newer approach: satellite observation (SEVIRI) of Fire Radiative Power to account for area burnt * fuel load • Increased variability • Still high uncertainty for estimates of burnt fuel and related emissions
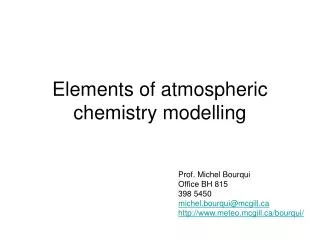
Fire Radiative Power area burnt combustionefficiency fuelload emissionfactor Global Wildfire Emission Modelling J. Hoelzemann Burnt Area from Satellite Biomass amount Emissions CO
CO biomass burning emissions – inter-annual variability http://www.gmes-atmosphere.eu/about/project_structure/input_data/d_fire/
Improving Forecast:Emissions modelling/observations vs.Initialisation with Analyses (Data Assimilation) Quality of NWP depends predominantly on initial state Atmospheric Composition modelling depends on initial state (lifetime) and fluxes (Emissions) Example: Volcanic Eruptions, Russian Fires,
SO2 forecasts from volcanic eruptions- • SO2 has shown to be a good proxy for volcanic ash • Volcanic SO2 can be observed from satellite • Simple chemistry (OH loss) and wet deposition • Ways to forecast SO2 plumes: • Estimate source strength and injection height and simulate transport with model (“CTM” -style) • Assimilate initial SO2 fields (initial conditions) and model transport (“NWP”-style)
SO2 satellite retrievals from GOME-2, OMI and SCIAMACHY Total Column SO2 on 20100507 By GOME-2, OMI and SCIAMACHY SO2 burden (Tg) over Iceland in May 2009, 2010 and 2011
Estimate plume strength and height information from satellite observations • Release test tracer at different levels - find best match in position • Scale emissions of test tracer observation to get emission estimate
Assimilation of Total Column SO2 from volcanoes • Problems: • Special extreme events (non-Gaussian characteristics) • No height information by the retrievals we used • Coverage limited (day time (UV), missing pixels • Solutions (trial and error) • Careful quality control, identification of plume • Use additional height information from plume estimate • Prescribed (“hand made”) error statistics with low background error at plume height • Horizontal correlation function 100km
Assimilation of TCSO2 - trials log Jb vs. normal Jb • Log Jb analysis were well confined but exaggerated high values • Log Jb needs plume in model (to be increased) • Normal Jb analysis ere to wide-spread but does not need prior plume • Improved by applying data quality control
TCSO2 forecast of volcanic eruptions based on UV-VIS satellite observations • The forecasts: • EMI (only with emission parameters estimate) • INI (only with initialisation & injection height)) • INI&EMI (initialisation and emission parameters estimate) • Evaluation • EMI forecast good during eruption closed to source • INI forecasts good after the eruption or far away • Combination brings best results • Still large uncertainty
Inverse modelling of emissions • Include emission parameters in state vector for data assimilation x = [xi xN , ej ] • Account for model parameter uncertainty by using weak constrained 4D VAR or Kalman Filter • Estimating error statistics is difficult therefore Kalman Filter methods are often used • Inverse methods (similar to 4DVAR) usually apply long assimilation windows to improve prior estimates (background) of emission fluxes • A workshop on parameter estimation and inverse modelling for atmospheric composition will be held from 22 to 24 October 2013.
Inverse modelling of Eyjafjallajökull Ash emissions Stohl et al, 2011, ACP
Summary • Atmospheric composition (AC) and weather interact • Modelling of AC needs to include many species with concentrations varying over several orders of magnitude • AC forecast benefit from realistic initial conditions (data assimilation) but likewise from improved emissions • Satellite observations can be used to infer emissions (direct observations, inverse methods) • MACC system produces useful AC forecast and analyses, freely available • More on the specifics of AC data assimilation of AC in Antje’s talk “Environmental Monitoring”