Karanhukar Powerhouse
300 likes | 537 Vues
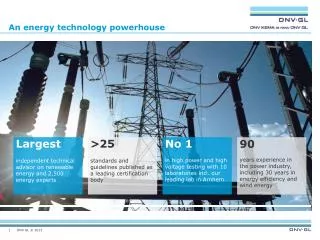
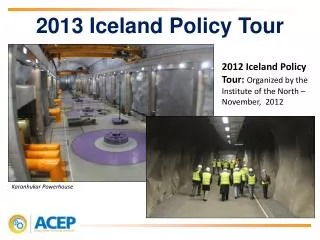
2013 Iceland Policy Tour. 2012 Iceland Policy Tour: Organized by the Institute of the North –November, 2012. Karanhukar Powerhouse . Presentation Organization. Policy Tour Overview – Gwen Holdmann Details from experience – Jason Meyer Student policy paper Dominique Pride Josh Miller

Karanhukar Powerhouse
E N D
Presentation Transcript
2013 Iceland Policy Tour 2012 Iceland Policy Tour: Organized by the Institute of the North –November, 2012 Karanhukar Powerhouse
Presentation Organization • Policy Tour Overview – Gwen Holdmann • Details from experience – Jason Meyer • Student policy paper • Dominique Pride • Josh Miller • Julie Emslie • Chris Pike (via podcast) • Lessons learned (all)
Why Iceland? • A chance for focused learning about a country with similar challenges and take them back to Alaska • Why are things done differently in other places? • Builds on Norway policy tour in 2012
Student Involvement Opportunity • 4 students selected – range of backgrounds • Sponsored by Institute of the North, ACEP and UAF • Developed 4 policy questions during and after visits, resulting in papers
Alaska’s Energy Challenges • High energy costs • Fragmented electric grid • Harsh climate • End of supply lines • Stranded resources • Dispersed population • Centralized economy • Diverse culturally
Alaska’s Energy Challenges • High energy costs • Fragmented electric grid • Diverse culturally • Harsh climate • End of supply lines • Stranded resources • Dispersed population • Centralized economy Similarities with Iceland
Alaska’s Energy Challenges • High energy costs • Fragmented electric grid • Diverse culturally • Harsh climate • End of supply lines • Stranded resources • Dispersed population • Centralized economy Dissimilarities with Iceland
Iceland in 1901 • Per capita national output was the same at today’s Ghana ($2500). • Dependent on one major industry (fishing). • Imported coal for heating. • Island environmentally decimated (all trees cut down, significant erosion of soil and stress on native vegetation due to overgrazing).
Reykjavik in 1932 All buildings heated using fossil fuels
Iceland Today • Estimated GDP per capita was $58,005 in 2008 • Ranks 3rd in the world in United Nation’s Human Development index • Only 18% of its total energy needs imported. • It took Iceland just 100 years (3 generations) to become one of the world’s most affluent countries.
Reykjavik today One of the cleanest cities in the world
Iceland Policy Tour - An Overview • Policy Meetings • Parliament • President • Ministry of Foreign Affairs • Ministry of Industries and Innovation • Renewable Energy Industry Visits to • LandsvikjunFljótsdalur power station • Reykjavik Geothermal • Municipality of Arborg/Selfoss District Heating • Hellisheidi Geothermal Plant • Mannvit Engineering • Verkis Consulting • Economic Development: Energy Intensive Industries • Alcoa Fjardaál aluminum smelter • Verne Global data center • FludaSveppir mushroom plant • Research/Education • University of Iceland • Gekon Consulting (cluster management)
Iceland Energy Themes • Identifying comparative advantages • Strategic, long-term planning • Investment • People • Institutions • Infrastructure
Iceland Energy Mix • 80% of primary energy supply comes from renewable resources (hydro, geothermal) • 99.9% of electricity production • 99% of space heating • Remaining 20% comes from imported fossil fuels, used mainly in transportation and fisheries Source Iceland National Energy Authority
Geothermal Energy in Iceland Space Heating Geothermal Utilization Source Iceland National Energy Authority
Hellisheidi Geothermal Plant 2nd largest geothermal plant 303 MW electricity 133 MW hot water
Electricity Profile (2010) Installed Capacity Electricity Production Electricity Consumption Source Iceland National Energy Authority
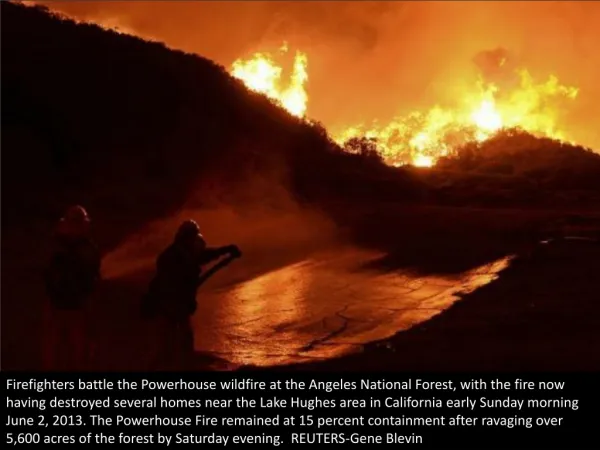
Kárahnjúkar Hydropower Plant 4,6000 GWh annually 690 MW installed capacity
FjardaálAluminum Smelter 940 tons of aluminum a day ~1% of world aluminum production
Iceland Exports (2011) Positive Trade Balance, 14%
Iceland Energy Planning • Comprehensive Energy Strategy for Iceland • Having renewable energy sources replace imported energy • Support diversified industry • Precautionary and protective approach in energy production • Master Plan for Utilization of Renewable Energy Resources • 80 different possibilities for hydropower and geothermal power plants have been listed and analyzed • Sustainability issues, preservation of natural environments and historic sites, tourism and alternative land use, regional development and economy • Sites put in three categories: • Green – Proceed with utilization process (apply for licenses etc.) – 8.5 TWh • Yellow – Site subject to further research – 12.5 TWh • Red – Site shall be preserved and not utilized for energy purposes – 11.3 TWh
UAF Energy Policy Research • 4 graduate students conducting targeted policy analysis papers for legislators • Overcoming barriers to transformation • District heating in Reykjavik • Geothermal development and knowledge economy • Kárahnjúkar project • Food security