Download
1 / 58
580 likes | 691 Vues
This report highlights the critical need for electrical system improvements in correctional facilities. Referencing the 'quiet crisis' in maintenance, it underscores the consequences of neglect, as evidenced by case studies from various facilities experiencing significant power outages due to ignored electrical issues. The report outlines a proactive process: establishing facility conditions, assessing problem likelihood, identifying at-risk equipment, and implementing predictive techniques for early problem detection. These measures aim to prevent costly failures and ensure operational continuity in vital correctional environments.

E N D
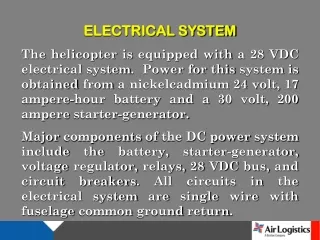
Aging Correctional Facility Electrical System Improvements David Loucks, P.E.
Process 1. Establish Current Condition of Facility 2. Determine Likelihood of Serious Problem Based on this Condition 3. Sort to Find Equipment Most at Risk to Cause Problems 4. Identify the Predictive Techniques that Gives Early Warning of Problems at that Equipment
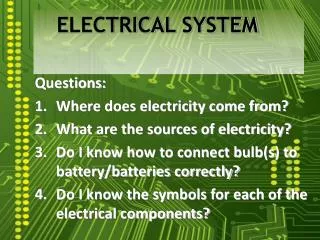
Situation • The ‘Quiet Crisis’Term created by Paul Hubbel, Deputy Director, Facilities and Services, Marine Corps. Government Executive Magazine, Sept 2002.When he was asked “why isn’t preventative maintenance adhered to more closely in government facilities?”“We call it the ‘quiet crisis’ because a lot of maintenance problems take time to occur and are not noticed (to be problems) until damage occurs”.
Correctional Facilities • Okay, so maybe the military has a problem with maintenance, but what about Correctional Facilities? • What happens if thepower goes out at yourfacility for an extendedperiod of time?
Case Study • WASCO State Prison, California Department of Corrections “Wasco suffered an electrical failure in April 1999 that caused a total power outage lasting almost seven hours-a problem that Wasco could have prevented had management made certain that staff repaired previously identified flaws in the electrical system.”California State Auditor/Bureau of State Audits Summary of Report Number 99118 - October 1999
Case Study • Yolo County Sheriff’s DetentionFacility, California On Tuesday, July 9th 2002, the Sheriff’s Department experienced a power outage. Normally, this is not a major problem as our backup generator provides electrical power in the event of an outage. However, this was not the case on July 9th, and the detention facilities did not have electrical power for four hours.”http://www.yolocountysheriff.com/myweb5/Sheriff%20Final/2002%20Commendation%20Awards/Tina%20Day.pdf
Case Study • Riverside Correctional Facility, Michigan“…however, in April 1998, RCF lost its main power source and the emergency generator failed to start. This resulted in an emergency situation for RCF.” Performance Audit, Michigan Department of Corrections, Feb 1999
Case Study • Mid-Michigan Correctional Facility (MMCF)“Finding:Preventive Maintenance and Safety InspectionsMMCF did not complete preventive maintenance and safety inspections on a timely basis. DOC policy and facility procedures require regular inspections to minimize equipment failures, breakdowns, or potential problem conditions with the facility's water, electrical, mechanical, and security systems and to identify and correct potential safety hazards. Performance Audit, Michigan Department of Corrections, June 1999
Why is Maintenance Skipped? • Clearly there are problems, but why? • Budget Cuts / Management Redirection of Maintenance Funds • This results in “Crisis Mode Operation” or “Fix What’s Broke and Skip the Rest” mentality • But how do you guess what will break next and where money should be targeted? • Is there an analytical way of targeting scarce resources?
1. Establish Current Condition of Facility 2. Determine Likelihood of Serious Problem Based on this Condition 3. Sort to Find Equipment Most at Risk to Cause Problems 4. Identify the Predictive Techniques that Gives Early Warning of Problems at that Equipment
Switchgear Failure Scenario 52 52 52 52 52 • What is the likelihood of a loss of MV power at either the Administration Building or at Health Services? • Answer:f(SW1) + f(CBL1)+ f(TX1)+ f(CBL2) + f(BKR1)+ f(RLY1)+ f(BUS1) + f(BKR2)+ f(RLY2)+ f(BKR5) + f(RLY5) + f(CBL6)- f(…) means hours/year failure rate SW1 CBL1 TX1 CBL2 BKR1 RLY1 51 BUS1 BKR2 BKR3 BKR4 BKR5 51 51 51 51 RLY2 RLY3 RLY4 RLY5 CBL3 CBL4 CBL5 CBL6 Admin Housing Unit 1 Housing Unit 2 Health Services
Failure Time / Year • Failures / Year • How often failures occur • Mean Time Between Failures • Duration (hrs) / Failure • How long it takes to repair a failure
1. Establish Current Condition of Facility 2. Determine Likelihood of Serious Problem Based on this Condition 3. Sort to Find Equipment Most at Risk to Cause Problems 4. Identify the Predictive Techniques that Gives Early Warning of Problems at that Equipment
IEEE Gold Book Analysis IEEE Std 493-1997, Table 7-1 * when no on-site spare is available ** below ground *** 3 connected to 3 breakers
Switchgear Failure Scenario 52 52 52 51 51 51 f(SW1) + f(CBL1)+ f(TX1)+ f(CBL2) + f(BKR1)+ f(RLY1)+ f(BUS1) + f(BKR2)+ f(RLY2)+ f(BKR5) + f(RLY5) + f(CBL6) • 1 incoming disconnect switch (.022 hrs/yr) • 300’ incoming MV cable (300/1000 * 0.1624 = 0.049 hrs/yr) • 1 incoming transformer (1.026 hrs/yr) • 100’ cable (TX to gear) (100/1000 * 0.1624 =0.0162 hrs/yr) • 1 MV bus run with 3 MV breakers (.2733 + 3(.2992)=1.1709 hrs/yr) • 3 protective relays (3*.001 = 0.003) • 300’ outbound MV cable (300/1000 * 0.1624 =0.049 hrs/yr) • Total = 0.022 + 0.049 + 1.026 + 0.0162 + 1.1709 hrs/yr + 0.003 + 0.049 = 2.33 hrs/yr (average) ?% uptime 8757.67 = 99.97% 8760 – 2.33
Equipment Failure Timing • Initial failures (installation problems, infant mortality of installed components). • Degradation over time (temperature, corrosion, dirt, surge) Initial Failures Degradation Failures Likelihood Of Failure Area under hatch marks represents the total likelihood of a failure 2.33 hrs/yr (average) Time
Equipment Failure Timing • Poor maintenance reduces equipment life since failures due to degradation come prematurely soon. IEEE says add 10% to likelihood of downtime. Initial Failures Early Degradation Failures Likelihood of failure is higher because postponed maintenance increases problems due to corrosion, misalignment, etc, that would be picked up in a PM program Likelihood Of Failure 2.59 hrs/yr (average) Time
Results • Fair Maintenance = 2.59 hrs/year downtime • Good Maintenance = 2.33 hrs/year downtime • 2.59 – 2.33 = 0.26 hr/yr less downtime • 16 minutes per year more downtimeIs that worth spending any time fixing? … but this is only a simple example
Real Systems Are Much Larger • 17 MV breakers • 14 MV loop feed switches • 3 switching elements • 42 total • 31 MV internal bus runs • (17+14) • 4000’ MV cable • 15 MV transformers • 3 standby generators Glenville Federal Penitentiary – MV System
LV System Are Very Complex Too… • 13 switchboards containing: • 155 LV breakers • 105 panelboards containing: • Over 2000 panelboard breakers • 1000’s of cable terminations • 30000 feet of cable Glenville Federal Penitentiary – LV System (Page 1 of 2)
Likelihood of Some Failure? Just looking at a portion of the equipment… • 42 MV disconnect switches (42 * .022 = 0.924 hrs/yr) • 4000’ MV cable (4000/1000 * 0.1624 = 0.649 hrs/yr) • 15 MV transformers (15.39 hrs/yr) • 30000’ LV cable (30000/1000 * 0.0148 = 0.444 hrs/yr) • 31 MV bus run with 17 MV breakers (31(0.2733) + 17(.2992)= 8.47 + 17.23 = 25.77 hrs/yr) • 17 protective relays (17*.001 = 0.017) • Total = 0.924 + 0.649 + 15.39 + 0.444 + 25.77 + 0.017 = 43.19 hrs/yr (average)(Assuming a 1 hr/per failure means you would expect an electrical problem 43 times per year or almost 1 per week!)
1. Establish Current Condition of Facility 2. Determine Likelihood of Serious Problem Based on this Condition 3. Sort to Find Equipment Most at Risk to Cause Problems 4. Identify the Predictive Techniques that Gives Early Warning of Problems at that Equipment
Final Step 1. Establish Current Condition of Facility 2. Determine Likelihood of Serious Problem Based on this Condition 3. Sort to Find Equipment Most at Risk to Cause Problems 4. Identify the Predictive Techniques that Gives Early Warning of Problems at that Equipment
Now What? • We now know how to figure “how many minutes of outage will occur each year” for each device. • But how do we reduce that value? • We can recognize that failures can be predicted if we recognize the early warning signs • The so-called “Predictive Indicator” • Once we know that, we can identify the likely cause and fix the problem before it is serious.
Predicting Failures Failure Contributing Causes Causes… Points to… Initiating Causes Causes… Points to… Predictive Indicator
Available Predictive Tools CBM – Condition Based Maintenance • Top 4 in order of importance are: • - Partial Discharge Diagnostics (22.4%)- Visual Inspection (18.1%)- On-Line Thermal Analyzer (15.6%)- Thermographic Inspections (12.0%)
What If We ImplementedOne Predictive Solution? • Partial Discharge – 22.4% of failures detected • Caveat: Only works on medium voltage (>1000 volts) • Our example prison: • 15.39 hrs/yr from transformer failure • 22.4% reduction 11.94 hrs/yr • 8.47 hrs/yr from MV bus failure • 22.4% reduction 6.57 hrs/yr • 17.23 hrs/yr from MV breaker failure • 22.4% reduction 13.37 hrs/yr
Reduction In Outages • Transformer Failure (was 15.39 hrs/yr, now 11.94 hrs/yr) • Saving 3.45 hrs/yr • MV bus failure (was 8.47 hrs/yr, now 6.57 hrs/yr) • Saving 1.9 hrs/yr • MV breaker failure (was 17.23 hrs/yr, now 13.37 hrs/yr) • Saving 3.86 hrs/yr • Total Savings from PD9.21 hrs/yr • 1 hr/failure = 9 fewer failures • 10 hr/failure = 1 fewer failure
Economic Justification * when no on-site spare is available ** below ground *** 3 connected to 3 breakers
Compute Likely FailureRate • Total Savings from PD9.21 hrs/yr • 1 hr/failure = 9 fewer failures per year • 10 hr/failure = 1 fewer failure per year • 25.4 hr/failure = 0.36 fewer failures per year • 1 fewer failure every 3 years 0.36 failures/ year 25.4 hrs/ failure
How Much Does It Cost? • We know that if we install PD sensors on all this equipment, statistically it will result in 1 less outage every three years. • Each PD sensor costs ~ $7000 installed • We have 92 items to be monitored • $7000 * 92 = $644000 • Does saving an outage once every 3 years justify spending $644000?
Your Mileage May Vary… Using this $10000 assumption… • At $10,000 / hour of downtime costs • Loss of one of the small power transformers would cost: • $537000 of downtime ($240,000 / day) • Cost of a 1000 kVA indoor dry, MV power transformer • Assume $18/kVA or $18000 • Assume labor $50/hr, 3 man-days labor • Total cost = (1000 * $18) + ($50 * 3 * 8) = $18000 + $1200Total cost = $19200 • Downtime and material = $537000 + $19200Downtime and material = $556200
Compute Payback • Our cost is $644000 • Our savings is $556200 once every 3 years or $185400 per year • Assume we expect a 10% return on invested capital • Assume 10 year project life • Assume 2.5% inflation rate
Compute Equivalent Payback • Cost = $644K, Savings = $185.4/yr, N=10 years, inflation = 2.5%, capital cost = 10% • Is this a good investment?
Compounded IRRCalculator Cost installed cost of equipment Savings annual savings a (1+g)/(1+i) i interest rate g annual inflation rate n duration (payback period in years)
Compounded IRRCalculator Cost $644,000 Savings $185,400 a (1+g)/(1+i) = (1+0.025)/(1+0.1) = 0.932 i 10% g 2.5% n 10
Run The Numbers… Cost $644,000 Savings $185,400 a (1+g)/(1+i) = (1+0.025)/(1+0.1) = 0.932 i 10% g 2.5% n 10
What Does 9.6 Mean? • Based on a cost of $644K, an annual savings of $185.4K, a required rate of return of 10%, and inflation rate of 2.5%… • 9.6 means a payback is achieved in 9.6 years • means that the payback is under 10 years • Since our project life is 10 years …this project is financially viable. Said another way: • This project completely pays for its initial capital expense, plus it returns 10% additional cash over the 10 year life.
Do I have To Do All ThisWork? • Yes…but • To simplify, use a web based calculator: • http://ppsnews.com/Internet/apps/pd/
I’ve Found Problems, NowWhat? • If you catch it before it fails catastrophically, you can rebuild • Many old electrical devices can be rebuilt to like new condition
LV Refurbished Power Breakers 510- Upgraded Trip 610- Display 810-KW-Comm-O/C 910-Harmonics • LV Equipment Retrofit / “Roll-In” Replacements - (W) - C-H - ITE - GE - AC - FPE - Siem - R-S
LV Rack-In Replacement With New (In Old Equipment) • Old Breaker: • Parts no longer available • Modern Breaker: • New warranty • Installed in the old structure
Motor Control Upgrades Breaker-to-Starter Conversions:- circuit breaker used to start motor- only good for 1000 or less operations- replace breaker with starter- now good for 1,000,000 operations Continuous Partial Discharge Monitor MCC Bucket Retrofits- new breaker and starter