Download
1 / 15
150 likes | 289 Vues
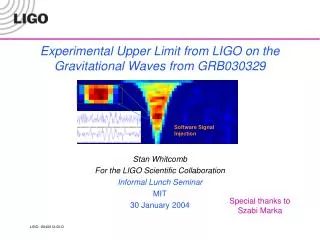
Experimental Upper Limit from LIGO on the Gravitational Waves from GRB030329. Software Signal Injection. Stan Whitcomb For the LIGO Scientific Collaboration Informal Lunch Seminar MIT 30 January 2004. Special thanks to Szabi Marka. HANFORD. 4 km + 2 km. MIT. 3. 0. 3. (. ±. 0.

E N D
Experimental Upper Limit from LIGO on the Gravitational Waves from GRB030329 Software Signal Injection Stan Whitcomb For the LIGO Scientific Collaboration Informal Lunch Seminar MIT 30 January 2004 Special thanks toSzabi Marka
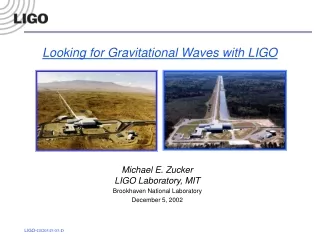
HANFORD 4 km + 2 km MIT 3 0 3 ( ± 0 1 k 0 m m s ) CALTECH LIVINGSTON 4 km LIGO Observatories MIT Lunch Seminar
Transition to Full Operation Science Runs Commissioning S1 (papers “in press”) 17 Days (Aug-Sep 2002) S2 (this talk) 59 Days (Feb- Apr 2003) S3 (even better) 70 Days (Oct 03 – Jan 04) MIT Lunch Seminar
GRBs during S2 Both Hanford detectors operating for GRB030329 MIT Lunch Seminar
“Signal” region +60 seconds -120 seconds Signal region and GRB030329 trigger • Relative delay between gravity wave and GRB predicted to be small • Signal region to cover most predictions • Known direction • Optical counterpart located • LIGO antenna factor identified • LIGO arrival times are known • Source distance is known • z=0.1685 (d~800Mpc) • Unknown waveform/duration http://www.mpe.mpg.de/~jcg/grb030329.html MIT Lunch Seminar
< > = 0 hrss2 Correlation Analysis MIT Lunch Seminar
4 3 2 1 5 Event Identification - Simulated Signal Color coding: “Number of variances above mean” Event strength [ES] calculation: Average value of the “optimal” pixels MIT Lunch Seminar
Analysis Flow Chart External Trigger Data Inject Simulated Signals Adaptive pre - conditioning Correlation detection algorithm Background region Simulations Signal region Noise event Spectrum Largest event Candidates Efficiency Measurements Upper limits Threshold Threshold MIT Lunch Seminar
Evidence for some correlated noise bursts between detectors? Estimated False Rate: 0.05-0.07 events in 180s Spectrum of Noise Events Note: Preliminary ! Based on ~15 ks of H1 & H2 coincident data around the GRB030329 “signal region” MIT Lunch Seminar
Optimal integration Integration length [ 4-120 ms, uneven steps ] Noise examples Optimal integration Time [ ~ms ] “Huge” Sine-Gaussian F = 361Hz, Q = 8.9 hRSS ~ 6x10-20 [1/Hz] “Small” Sine-Gaussian F = 361Hz, Q = 8.9 hRSS ~ 3x10-21 [1/ Hz] (~ detection threshold) Sensitivity Determination MIT Lunch Seminar
Detection Efficiency at Fixed False Alarm Rate Note: Preliminary ! Lines: 90% detection efficiency boundaries • Calibration known within ~10% • Detection efficiencies obtained for threshold corresponding to ~4 x 10⁻⁴ Hz false alarm rate (<10%probability of noise event in 180 sec) • H1/H2 noise curves reflect levels around GRB030329 Symbols: 50% detection efficiency points MIT Lunch Seminar
Events Within the Signal Region Note: Preliminary ! • The signal region seems to be “relatively quiet” when compared to the neighboring regions • No event was detected with strength above the pre-determined threshold • It is an upper limit result Threshold for <10% false alarm probability MIT Lunch Seminar
hrss2 Observed Limit on hrss Relates to GW Energy For an observation (or limit) made at a luminosity distance d from a source MIT Lunch Seminar
Example: Estimating EGW for GRB030329 Note: Preliminary ! H1-H2 only Antenna attenuation factor ~0.37 (assuming optimal polarization) z = 0.1685 d 800Mpc • For narrowband GWs near minimum of noise curve (simulated with Q9 250 Hz sine-Gaussian), obtain 90% efficiency • hRSS < 5 10-21 [1/Hz] • EGW < 125 M(1 / 0.37) 340 M ~ ~ MIT Lunch Seminar
Summary and Prospects for Future Searches • Executed a sensitive, cross-correlation based search for gravitational wave bursts around GRB030329 • Sensitivity (depending on frequency) hRSS < few x 10-21 [1/Hz] • Current limit of some hundreds of M in GWs • Detector improvement: both detectors, factor of 10 – 30 (in hrss) between S2 and final sensitivity (depending on frequency…) improvement of 100 – 300 in EGW • Beaming factor: estimate for every GRB detected, 100 to 500 “missed” -- reasonable for one year of observation might give 10 times closer event (cf. SN1998bw at ~ 40 Mpc) another factor of 100 in EGW • More detectors, better location in antenna pattern, better discrimination against noise events…. • very realistic chance to set a sub-solar mass limit in the near future MIT Lunch Seminar