Download
1 / 38
390 likes | 500 Vues
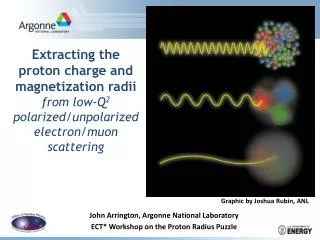
Extracting the proton charge and magnetization radii from low-Q 2 polarized/unpolarized electron/muon scattering. Graphic by Joshua Rubin, ANL. John Arrington, Argonne National Laboratory ECT* Workshop on the Proton Radius Puzzle. Outline. JLab form factor measurements

E N D
Extracting the proton charge and magnetization radiifrom low-Q2 polarized/unpolarized electron/muon scattering Graphic by Joshua Rubin, ANL John Arrington, Argonne National Laboratory ECT* Workshop on the Proton Radius Puzzle
Outline • JLab form factor measurements • Polarization technique • Two-photon exchange • Proton structure • JLab low Q2 data, proton radius analysis [X. Zhan, et al., PLB 705 (2011) 59] • General considerations in extracting radius from scattering data • Corrections beyond two-photon exchange?? [JA, arXiv:1210.2667]
New techniques: Polarization and A(e,e’N) • Mid ’90s brought measurements using improved techniques • High luminosity, highly polarized electron beams • Polarized targets (1H, 2H, 3He) or recoil polarimeters • Large, efficient neutron detectors for 2H, 3He(e,e’n) Unpol: tGM2+eGE2 Pol:GE/GM Polarized 3He target BLAST at MIT-Bates Focal plane polarimeter – Jefferson Lab
Two Photon Exchange • Proton form factor measurements • Comparison of precise Rosenbluth and Polarization measurements of GEp/GMp show clear discrepancy at high Q2 • Two-photon exchange corrections believed to explain the discrepancy • Minimal impact on polarization data P.A.M.Guichon and M.Vanderhaeghen, PRL 91, 142303 (2003) • Have only limited direct evidence of effect on cross section • Active program to fully understand TPE P. G. Blunden et al, PRC 72 (2005) 034612 A.V. Afanasev et al, PRD 72 (2005) 013008 D. Borisyuk, A. Kobushkin, PRC 78 (2008) 025208C. Carlson, M. Vanderhaeghen, Ann. Rev. Nucl. Part. Sci. 57 (2007) 171 JA, P. Blunden, W. Melnitchouk, PPNP 66 (2011) 782 + several completed or ongoing experiments M.K.Jones, et al., PRL 84, 1398 (2000) O.Gayou, et al., PRL 88, 092301 (2003) I.A.Qattan, et al., PRL 94, 142301 (2005)
Quark Orbital Angular Momentum Many calculations reproduce recently observed falloff in GE/GM • Descriptions differ in details, but nearly all were directly or indirectly related to quark angular momentum S. Boffi, et al. F. Cardarelli, et al. P. Chung, F. Coester F. Gross, P. Agbakpe G.A. Miller, M. Frank C. Perdrisat, V. Punjabi, and M. Vanderhaeghen, PPNP 59 (2007)
1 fm Insight from Recent Measurements • New information on proton structure • GE(Q2) ≠ GM(Q2) different charge, magnetization distributions • Connection to GPDs: spin-space-momentum correlations Model-dependent extraction of charge, magnetization distribution of proton: J. Kelly, Phys. Rev. C 66, 065203 (2002) A.Belitsky, X.Ji, F.Yuan, PRD69:074014 (2004) G.Miller, PRC 68:022201 (2003) x=0.1 x=0.4 x=0.7
Transverse Spatial Distributions • Simple picture: Fourier transform of the spatial distribution • Relativistic case: model dependent “boost” corrections • Model-independent relation found between form factors and transverse spatial distribution • r(b,x) = ∑ eq∫ dx q(x,b) = transverse density distribution in infinite momentum frame (IMF) for quarks with momentum x • Natural connection to GPD picture • Evaluated for proton, with experimental and truncation uncertainties PROTON NEUTRON S.Venkat, JA, G.A.Miller, X.Zhan, PRC83, 015203 (2011) G. Miller, PRL 99, 112001 (2007); G. Miller and JA, PRC 78:032201,2008
Transverse Spatial Distributions • Simple picture: Fourier transform of the spatial distribution • Relativistic case: model dependent “boost” corrections • Model-independent relation found between form factors and transverse spatial distribution r(b,Dx): neutron • r(b,x) = ∑ eq∫ dx q(x,b) = transverse density distribution in infinite momentum frame (IMF) for quarks with momentum x • Natural connection to GPD picture • Evaluated for proton, with experimental and truncation uncertainties Sea quarks (x<0.1) Intermediate x region Valence quarks S.Venkat, JA, G.A.Miller, X.Zhan, PRC83, 015203 (2011) G. Miller, PRL 99, 112001 (2007); G. Miller and JA, PRC 78:032201,2008
Q4F2q/k Q4 F1q Slide from G. Cates
Proton Charge Radius Extractions Pohl, R. et al. Nature 466, 213-217 (2010) Lamb shift: largest ‘uncertainty’ is correction for size of proton Precise measurement of Lamb shift measure proton RMS radius Muonic Hydrogen: Radius4% below previous best value • Proton 13% smaller, 13% denser than previously believed • Directly related to strength of QCD in non-perturbative region
Proton Charge Radius Extractions Pohl, R. et al. Nature 466, 213-217 (2010) Lamb shift: largest ‘uncertainty’ is correction for size of proton Precise measurement of Lamb shift measure proton RMS radius Muonic Hydrogen: Radius4% below previous best value • Proton 13% smaller, 13% denser than previously believed • Directly related to strength of QCD in non-perturbative region (which would be really important if we actually knew how to extract “strength of QCD” in non-perturbative region)
X. Zhan, et al., PLB 705 (2011) 59; G. Ron, et al., PRC 84 (2011) 055204 Low Q2 data: • JLab E08-007 and “LEDEX” polarization transfer data • 1-2% uncertainty on GE/GM • Less sensitive to TPE • Updated global fit • Improves form factors over Q2 range of the data • Constrain normalization of data sets over wider Q2 range • Low Q2 fit to extract radius; fix slopes for global (high-Q2) fit Details of full (high-Q2) fit: S.Venkat, JA, G.A.Miller, X. Zhan, PRC 83 (2011) 015203
JLab radius extraction from ep scattering • Fit directly to cross sections and polarization ratios • Limit fit to low Q2 data • Two-photon exchange corrections (hadronic) applied to cross sections • Estimate model uncertainty by varying fit function, cutoffs • Different parameterizations (continued fraction, inverse polynomial) • Vary number of parameters (2-5 each for GE and GM ) • Vary Q2 cutoff (0.3, 0.4, 0.5, 1.0) P. G. Blunden, W. Melnitchouk, J. Tjon, PRC 72 (2005) 034612
Some other issues • Relative normalization of experiments: • - Typical approach: fit normalizations and then neglect uncertainty (wrong) • - Ingo Sick’s approach: do not fit normalizations; vary based on quoted uncertainties to evaluate uncertainties (correct - conservative) • Our approach: Fit normalization factors, vary based on remaining uncertainty from fit • Systematics hard to tell how well we can REALLY determine normalization • We set minimum uncertainty to 0.5% Most older extractions dominated by Simon, et al., low Q2 data - 0.5% pt-to-pt and norm. systematics - Neglects uncertainty in Radiative Corr. We apply TPE uncertainty consistent with other data sets
Proton RMS Charge Radius Muonic hydrogen disagrees with atomic physics and electron scattering determinations of slope of GE at Q2 = 0. JLab CODATA 10 9 s between electron average and muonic hydrogen
Proton magnetic radius • Significant (3.4s) difference between Mainz and JLab results • 0.777(17) fm • 0.867(20) fm • Need to fully understand this before we can reliably combine the electron scattering values?
Robustness of theresults • Magnetic form factor, radius much more difficult to extract • GE dominates the cross section at low Q2 • Reduced sensitivity to GM • High-Q2 data can dominate fit when low-Q2 data is less precise • Extrapolation to e=0 very sensitive to q-dependent corrections • Two-photon exchange • Experimental systematics • Cross section, electron momentum, radiative corrections all vary rapidly with scattering angle • Relative normalization between data sets with different e ranges From here on, I take liberties with the Mainz data to demonstrate that while RM is potentially sensitive to such effects, RE is much more robust
Difficulties in extracting the radius Want enough Q2 range to constrain higher terms, but don’t want to be dominated by high Q2 data; Global fits almost always give poor estimates of the radii Note: linear fit will always give underestimate of radius for form factor that curves upwards Dipole Linear fit
Difficulties in extracting the radius (slope) 1-GE(Q2) Want enough Q2 range to constrain higher terms, but don’t want to be dominated by high Q2 data; Global fits almost always give poor estimates of the radii Note: linear fit will always give underestimate of radius for form factor that curves upwards I. Sick, PLB 576, 62 (2003) Q2 [GeV2] : 0 0.01 0.04 0.09 0.15 0.23
Difficulties in extracting the radius (slope) 1-GE(Q2) Want enough Q2 range to constrain higher terms, but don’t want to be dominated by high Q2 data; Global fits almost always give poor estimates of the radii Note: linear fit will always give underestimateof radius for form factor that curves upwards I. Sick, PLB 576, 62 (2003) Q2 [GeV2] : 0 0.01 0.04 0.09 0.15 0.23 Linear fit error(stat)4.7% 1.2% 0.5% 0.3% 0.2% Truncation Error (GDip) 0.8% 3.3% 7.5% 12% 19% Fits use ten 0.5% GE values for Q2 from 0 to Q2max
Optimizing the extractions Max. Q2 [GeV2] : 0.01 0.04 0.09 0.15 0.23 0.4 Linear fit error (stat) 4.7% 1.2% 0.5% 0.3% 0.2% 0.1% Truncation error (GDip) 0.8% 3.3% 7.5% 12% 19% 32% Quadratic fit error 19% 4.5% 1.9% 1.1% 0.6% 0.3% Truncation error: 0 0.1% 0.6% 1.4% 3.1% 7.5% Cubic fit error 48% 11.5% 4.9% 2.8% 1.7% 0.8% Truncation error: 0 0 0.1% 0.2% 0.5% 1.7% Linear fit: Optimal Q2=0.024 GeV2, dR=2.0%(stat), 2.0%(truncation) Quadratic fit: Optimal Q2 = 0.13 GeV2, dR=1.2%(stat), 1.2%(truncation) Cubic fit: Optimal Q2 = 0.33 GeV2, dR=1.1%(stat), 1.1%(truncation) Note: Brute force (more data points, more precision) can reduce stat. error Improved fit functions (e.g. z-pole, CF form) can reduce truncation error, especially for low Q2 extractions “Tricks” may help further optimize: e.g. decrease data density at higher Q2, exclude data with ‘large’ GM uncertainties
Difficulties in extracting the radius (slope) Very low Q2 yields slope but sensitivity to radius is low Larger Q2 values more sensitive, have corrections due to higher order terms in the expansion Want enough Q2 range to constrain higher terms, but don’t want to be dominated by high Q2 data; Global fits almost always give poor estimates of the radii More important for magnetic radius, where the precision on GM gets worse at low Q2 values JA, W. Melnitchouk, J. Tjon, PRC 76, 035205 (2007) Very low Q2 kinematics can have 1% cross sections yielding intercept (GM2) known to 25%
Weighted average: 0.777 Averaging of fits? “By eye” average of high-N fits • Limited precision on GM at low Q2 means that more parameters are needed to reproduce low Q2 data • Low Nparfits may be less reliable • Statistics-weighted average of fits with different #/parameters • Emphasizes small Npar • Expect fits with more parameters to be more reliable • Increase <rM>2 by ~0.020 • Increase “statistical” uncertainty • No visible effect in <RE>2
Two-photon exchange corrections • Mainz analysis applied Q2=0 (point-proton) limit of “2nd Born approximation” for Coulomb corrections • Applied 50% uncertainty in GE, GM fit (no uncertainty in radius) QED: straightforward to calculate Q2=0 Q2=0.03 Q2=0.1 m m QED+QCD: depends on proton structure Q2=0.3 Q2=1 JA , PRL 107, 119101 J.Bernauer, et al., PRL 107, 119102
JA , PRL 107, 119101; J.Bernauer, et al., PRL 107, 119102 Impact of TPE Apply low-Q2 TPE expansion, valid up to Q2=0.1 GeV2 Small change, but still larger than total quoted uncertainty Borisyuk/Kobushkin, PRC 75, 028203 (2007) RADII: <rE2>1/2 goes from 0.879(8) to 0.876(8) fm [-0.3%] <rM2>1/2 goes from 0.777(17) to 0.803(17) fm [+3.0%] Note: these uncertainties do not include any contribution related to TPE: Change between default prescription and this suggests TPE uncertainty of approximately 0.003 fm for rE, 0.026 fm for rM Much (most?) of the effect associated with change in normalization factors of the different data subsets
Comparison of low Q2 TPE calculations: Blunden, et al., hadronic calculation [PRC 72, 034612 (2005)] Borisyuk & Kobushkin: Low-Q2 expansion, valid up to 0.1 GeV2[PRC 75, 038202 (2007)] B&K: Dispersion analysis (proton only) [PRC 78, 025208 (2008)] B&K: proton + D[arXiv:1206.0155] Typical uncertainties for radiative corrections are 1-1.5%; probably fair (or overestimate) after applying TPE calculations, at least for lower Q2 Combining world’s data (or taking Mainz data set) yields enough data that it’s not sufficient to treat as uncorrelated or norm. uncertainties Full TPE calculations
Proton magnetic radius • Updated TPE yields DRM=0.026 fm 0.777(17) 0.803(17) • Remove fits that may not have sufficient flexibility: DR≈0.02 fm? • Mainz/JLab difference goes from 3.4s to 1.7s, less if include TPE uncertainty • RE value almost unchanged: 0.879(8) 0.876(8) • Higher-order Coulomb corrections?
Additional Coulomb Corrections? [JA, arXiv:1210.2677] 2nd Born • CC: 2nd born approximation • Increases charge radius ~0.010 fm • [Rosenfelder PLB479(2000)381, Sick PLB576(2003)62] • + hard 2g corrections • Minimal impact (additional 0.002 fm) • [Blunden and Sick, PRC72(2005)057601] • Low Q2: CC in 2nd Born become small but non-zero • Very low energies, might expect large corrections (classical limit) • Could this have any impact on the radii extracted from data?
Additional Coulomb Corrections? 2nd Born • Effective Momentum Approximation • Coulomb potential boosts energy at scattering vertex • Flux factor enhancement • Used in QE scattering (Coulomb field of nucleus) • Key parameter: average e-p separation at the scattering • ~1.6 MeV at surface of proton • Decreases as 1/R outside proton EMA
Additional Coulomb Corrections? 2nd Born • Effective Momentum Approximation • Coulomb potential boosts energy at scattering vertex • Flux factor enhancement • Used in QE scattering (Coulomb field of nucleus) • Key parameter: average e-p separation at the scattering • ~1.6 MeV at surface of proton • Decreases as 1/R outside proton • Assume scattering occurs at R = 1/q • Limits correction below Q20.06 GeV2 where scattering away from proton EMA
Additional Coulomb Corrections? EMA • Very little effect at high e ; no impact on charge radius • Large Q2 dependence at low e, especially at very low Q2 • Proton radius slope -600%/GeV2 • 0-0.02 GeV2: CC slope +100%/GeV2 • 0.05-0.2 GeV2: slope -8%/GeV2 • Higher e: up to ~15%/GeV2 • Couldimpact extraction of magnetic radius • Need real calculation • Need to apply directly to real kinematics of the experiment EMA e= 0.02
How many parameters is enough? Too many? Simulated data World’s data (w/o Bernauer) Black points: Total chi-squared for fit to “Fit” data vs. N = # of param. Red points: Comparing result of fit to independent “Reference” data set (generated according to same distribution as “Fit” data)
Summary • Inconsistency between muonic hydrogen and electron-based extractions • Fits from scattering data must take care to avoid underestimating uncertainties, but charge radius is significantly more robust • Future experiments planned • Better constrain GM at low Q2 • Map out structure of GE at low Q2 • Check TPE in both electron and muon scattering • Directly compare electron and muon scattering cross sections
JA , PRL 107, 119101; J.Bernauer, et al., PRL 107, 119102 Impact of TPE Apply low-Q2 TPE expansion, valid up to Q2=0.1 GeV2 Small change, but still larger than total quoted uncertainty Borisyuk/Kobushkin, PRC 75, 028203 (2007) RADII: <rE2>1/2 goes from 0.879(8) to 0.876(8) fm [-0.3%] <rM2>1/2 goes from 0.777(17) to 0.803(17) fm [+3.0%] Note: these uncertainties do not include any contribution related to TPE: Change between default prescription and this suggests TPE uncertainty of approximately 0.003 fm for rE, 0.026 fm for rM
Fit (and normalization) uncertainties • Best fit starting radius, normalization factors • Vary radius parameter and refit, determine Dc2 vs. radius (allowing everything including normalizations to vary) • Different functional forms & data range to check systematic: - CF, Polynomial fits ; N = 3, 4, 5 ; Q2 <0.5 (0.3, 0.4, 1.0)
How well can we determine the normalizations? • Quoted normalization uncertainties of ~2-4%; Fit yields 0.2-1.0% • Polarization data very helpful in linking low and high e data; less room to trade off between slope in reduced cross section and normalization factors • These analyses neglect correlated uncertainties: a Q2-dependent or e-dependent systematic can yield incorrect normalization • Hard to be sure that normalization is known to much better than 0.5% Assumed minimum uncertainty