
Uploaded by
lacy-faulkner
4 SLIDES
443 VUES
120LIKES
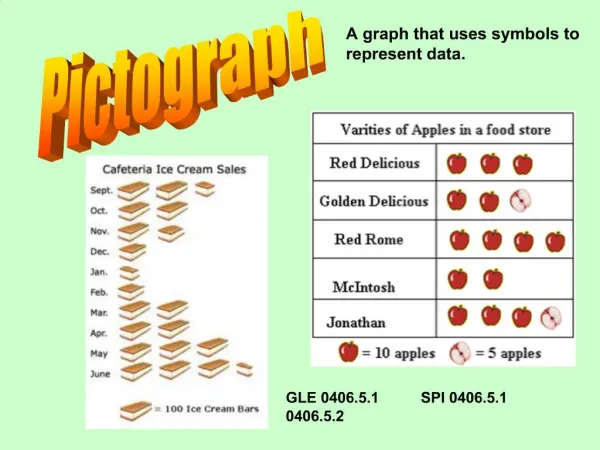
Froot Loop Pictograph
DESCRIPTION
Froot Loop Pictograph. RED- ORANGE- YELLOW- GREEN- BLUE- PURPLE-. Froot Loop Table. What color do you predict will be the most popular color in the data __________________?. Froot Loop Group #1 Table Katina, Beth, Caroline, Sandra, and Dr. Monroe. Total. Froot Loop Group #2 Table
Download
1 / 4
Télécharger la présentation 
Froot Loop Pictograph
An Image/Link below is provided (as is) to download presentation
Download Policy: Content on the Website is provided to you AS IS for your information and personal use and may not be sold / licensed / shared on other websites without getting consent from its author.
Content is provided to you AS IS for your information and personal use only.
Download presentation by click this link.
While downloading, if for some reason you are not able to download a presentation, the publisher may have deleted the file from their server.
During download, if you can't get a presentation, the file might be deleted by the publisher.
E N D
Presentation Transcript
Froot Loop Pictograph RED- ORANGE- YELLOW- GREEN- BLUE- PURPLE-
Froot Loop Table What color do you predict will be the most popular color in the data __________________?
Froot Loop Group #1 Table Katina, Beth, Caroline, Sandra, and Dr. Monroe Total
Froot Loop Group #2 Table Carolyn, Jessica, Stacie, and Robyn Total


More Related
Audio
Live Player