Download
1 / 28
280 likes | 381 Vues
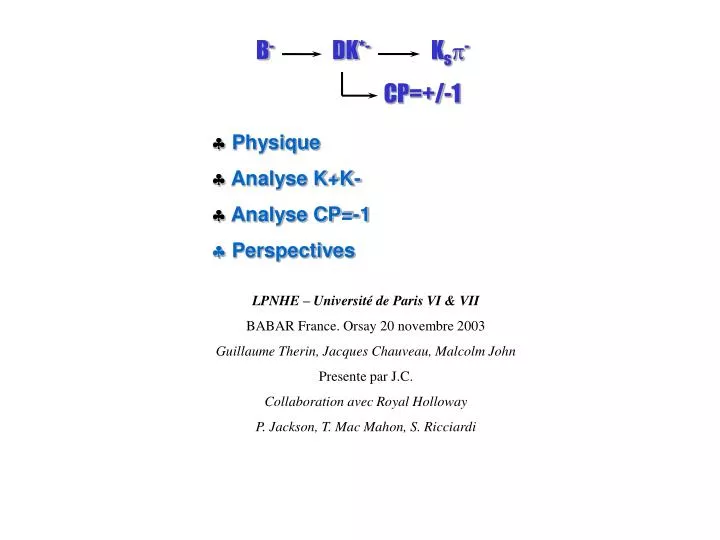
B - DK* - K s p - CP=+/-1. Physique Analyse K+K- Analyse CP=-1 Perspectives. LPNHE – Université de Paris VI & VII BABAR France. Orsay 20 novembre 2003 Guillaume Therin, Jacques Chauveau, Malcolm John Presente par J.C.

E N D
B- DK*- Ksp- CP=+/-1 • Physique • Analyse K+K- • Analyse CP=-1 • Perspectives LPNHE – Université de Paris VI & VII BABAR France. Orsay 20 novembre 2003 Guillaume Therin, Jacques Chauveau, Malcolm John Presente par J.C. Collaboration avec Royal Holloway P. Jackson, T. Mac Mahon, S. Ricciardi
Objectif : Contraindre g par des canauxsans pingouins. • Méthodes : • GLW prototype, faisable ?, amplitudes très différentes • ADS très faibles rapports de branchement , amplitudes du même ordre. u u u • Etats propres de CP Vus s u B b u K- D0 Ksp0 KK Vub Vcb SC SC c A B- p+p- Ksr0 b c s B- D0 Ksf K- ... u • Mauvais signes g BF = 3.7 x 10⁻⁴ A(B-→D0K-) DC CA BF ≈ 3 x 10⁻⁶ B→D0K BF ≈ 1.5 x 10⁻⁴ K+p- BF = 3.8 x 10⁻² B B eid eid g B A=A* B* A(B+→D0K+) • Triangles GLW • Triangles analogues pour ADS • Violation de CP directe,… • ou pas de violation de CP A=A* Belle : A1 = -0.02+-0.33+-0.07 Désintégrations des B en D K(*) • http://lpnhe-babar.in2p3.fr/DK G. Thérin B->DK*
Analyse CP=+1 • Run 1 et 2 D0 -> K+K- • Comparaisons données Monte Carlo • Optimisation des coupures • Statistiques attendues pour une expérience complètement simulée (FSE) • Signal • Bruits de fond • bruit de fond doublement piquant G. Thérin B->DK*
Data Sets Data SampleLuminosity (fb-1) • We have all generic SP4 reconstructed with release 10 • Both data and generic MC taken from the Breco skims • Enough generic to do a full simulated Experiment • All yields are normalised to 73.4 fb-1 188 184 uds 93.4 c 92.9 CP Cocktail 1250* KK Signal 16400 On-Peak Data 73.4 Off-Peak Data 8.6 G. Thérin B->DK*
Cut Optimization 40 DE (MeV) -40 5.29 5.20 5.27 MES (GeV/c2) • Assumptions : • Method : • Cut variables uncorrelated with mes and DE (checked). • Good agreement between MC and Data • For the optimization, mesis assumed to be uniform (BKGD) for (5.2 < mes< 5.29) GeV/c2 • BF(signal) = 7.10-7 • Determine - NSIGNAL (signal MC) • - NBKGD (generic udscb) • found in the signal box G. Thérin B->DK*
No appreciable correlations between DE and All other cuts Plots done on data with mes < 5.27 G. Thérin B->DK*
No appreciable correlations between mes and All other cuts Plots done on Data with |DE| > 0.04 G. Thérin B->DK*
Off-peak data compared with generic udsc Fair agreement between data and new qq MC G. Thérin B->DK*
On-peak data compared with generic mes < 5.27 GeV G. Thérin B->DK*
Significance versus cut variations • The vertical black bar shows the choice for the cut • favored loose cuts G. Thérin B->DK*
Signal Bcgk • Cut Optimization plots G. Thérin B->DK*
Cut Values MC Signal e = 16.4 ± 0.4 % • Best Candidate : • c2(mD0,mKs) • 14.5% selected events have more than 1 candidate • Legendre Fisher : • F = 0.53 - 0.60*L0 + 1.27*L2 G. Thérin B->DK*
Full Simulated Experiment (1) B- D0K*- Ks- K+K- • Full Simulated Experiment : • normalised to the data (73.4 fb-1) • BF(signal) = 7.10-7 FSE Data G. Thérin B->DK*
Échantillons de contrôle • Échantillons • D pi avec D-> K pi • D pi avec D-> K K • Différence entre MC et données • Facteurs d’échelle • shifts • paramètres pour le fit sur les données • correction d’efficacité des coupures G. Thérin B->DK*
B- DK*- Ksp- K+K- B- Dp- K+p- B- Dp- K+K- • Control samples (1) D E parameterization m = -0.2 ± 0.3 MeV s = 15.9 ± 0.3 MeV m = -0.5 ± 0.3 MeV s = 15.7 ± 0.3 MeV m = 1.0 ± 0.3 MeV s = 10.8 ± 0.3 MeV MC m = -4.3 ± 0.6 MeV s = 16.6 ± 0.6 MeV m = -3.5 ± 1.0 MeV s = 18.6 ± 1.0 MeV Data G. Thérin B->DK*
B- DK*- Ksp- K+K- B- Dp- K+p- B- Dp- K+K- • Control samples (2) mes parameterization m =2579.26±0.03 MeV s = 2.50 ± 0.03 MeV m =5279.14±0.04 MeV s = 2.51 ± 0.03 MeV m =5279.28±0.06 MeV s = 2.50 ± 0.05 MeV MC • m =5279.87 ± 0.09 MeV • = 2.56 ± 0.07 MeV e= 5290.6 ± 0.9 MeV • m =5279.88±0.1MeV • = 2.6 ± 0.1 MeV e = 5290.8 ± 0.6 MeV Data G. Thérin B->DK*
Systematic errors : • Only for run 1 &2 and SP4 • Tracking, Ks and PID efficiencies taken from analog analyses in AWG • Correction factors due to Data/MC mismatch carefully studied • Fit parameters and stability yet to be done. • Yields : Efficiency Errors (%) • Monte Carlo statistics - 2.2 • Tracking efficiency (3GTVL&CT) • D Ks - 3*1.3=4 • D(K pi)K* 0.96 3*0.8=2.4 • Ks efficiency 0.98 3 • Kaon ID - 2 • Correction factors for cuts • Peaking background (below) • Fit parameters • Asymmetry : Charge asymmetry tracking/PID - 0.3 • BR : • B counting 1.1 % - 1.1 • Branching fractions (from Ks)[PDG] - 0.39 G. Thérin B->DK*
Full Simulated Experiment (9 generated events) • Fit z on sidebands |DE|> 60 MeV, then fit the same shapeon signal band |DE|<40 MeV • mes (Argus+Gaus) • m = 5.2793 GeV (fixed) • = 2.5 MeV (fixed) Endpoint = 5.29 GeV (fixed) • = 33.4 ± 6.9 (fixed) DE (P1+Gaus) mes > 5.27 GeV m = 1 MeV (fixed) s = 10.8 MeV (fixed) slope = -1.1 ± 1.0 8.2 ± 3.8 events 5.1 ± 3.6 events G. Thérin B->DK*
D0(K+ K-) K*-(Ks pi-) [FSE] 1D 1D 2D fit with fixed gaussian parameters 8.7+3.9-3.2 for 9.0 generated events G. Thérin B->DK*
Data sample fitting A+G(mes) counting Generic B+B- 3.2 +/- 1.4 4.7 +/- 1.4 (2.7 K*KK) Generic B0B0 0.0 +/- 0.2 0.4 +/- 0.4 CP Cocktail - 1.3 K*KK Signal MC (BR 10-5) - 1.1 +/- 0.1 • B K*KK • B D0Ksp • B D*K* Estimated peaking BGCK : 3.2 +/- 1.4 +/- ? (unknown BR) K*KK signal MC • Peaking Background Will be studied on data G. Thérin B->DK*
Outlook (CP=+1) • Finish BAD 697 v1 on run 1 & 2 data. No request to unblind. • Ntuple production on reprocessed run 1-to-3 data and SP5 complete. • Cross check with D0 in Kp • Add p+p- mode into a common CP+1 analysis • Unblind at the Breco AWG meeting before the Dec. Collab. Meeting • Mes when M(K+K-) in D0 mass sideband (> 4 s) G. Thérin B->DK*
Analyse CP=-1 First look • Run 1 et 2 D0 -> Ks Phi, Ks pi0 • Comparaisons données Monte Carlo • Statistiques attendues (FSE) • Signal • Bruits de fond G. Thérin B->DK*
CP=-1 Ks Phi coupures non réoptimisées, mais familières G. Thérin B->DK*
CP=-1 Ks pi0 G. Thérin B->DK*
Perspectives • Tous les ntuples analysis 12, sont produits (presque tous). Avec une fenêtre de +/- 90 MeV sur M_D0. • Analyse CP=+1 • Etude complète du mode K+K- sur run 1-2 • La suite sur run 1-2-3 • Etude du bruit de fond piquant sur les données • Modifications minimes de coupures • Addition du mode pi+ pi- • Objectif: ouvrir la boite en décembre • Analyse CP=-1 • 1er passage présenté. • Résultats + solides en décembre sur le + de modes possibles • Analyse combinée CP=+/-1 • Résultats préliminaires présentables à une conf. d’hiver • PRL d’ici l’été • En chantier : • D0 K+ pi- et autres modes de mauvais signe • K* K- pi0 G. Thérin B->DK*
Antisèches G. Thérin B->DK*
B- DK*- Ksp- K+K- B- Dp- K+p- B- Dp- K+K- • Control samples (3) Study correction factors DE mes DE mes DE mes G. Thérin B->DK*
Correction factors G. Thérin B->DK*