Download
1 / 61
610 likes | 737 Vues
State of the University Fall 2007 Incoming Class Campus Update John F. Carney III, Ph.D., PE December 3, 2007. Issues. Enrollment Advancing Excellence Capital Campaign Student design teams Research activities Capital projects University rankings Branding/marketing activities

E N D
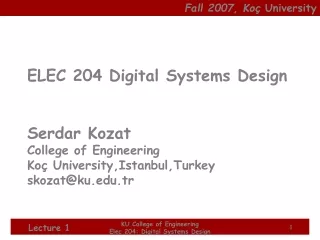
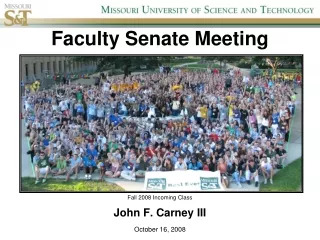
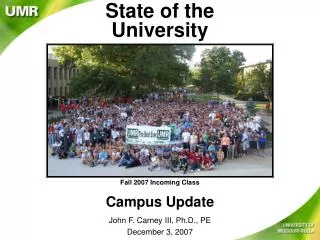
State of the University Fall 2007 Incoming Class Campus Update John F. Carney III, Ph.D., PE December 3, 2007
Issues • Enrollment • Advancing Excellence Capital Campaign • Student design teams • Research activities • Capital projects • University rankings • Branding/marketing activities • What is next? • Other news • Questions/comments • DVD
EnrollmentFall 2007 • Enrollment of 6,167 students – 33.3% increase since 2000 • 1,051 new first-time freshmen (7.6%) • 276 new transfer students (3.8%) • 434 new graduate students (10.7%) • Freshmen class profile • 29 states • 9 foreign countries • Average ACT 27.4 (upper 10% in nation) • 86% interested in engineering and science fields
EnrollmentFall 2007 • Highest female enrollment in over 20 years (1,391) • Record enrollments for • American Indian/Alaskan Native (33) • African American (271) • Hispanic American (139)
Importance of the Humanities, Social Sciences, and Business
RI DE DC MD Legend 50 or more students 10 – 49 students 1 - 9 students No students SO. CAROLINA University of Missouri - Rolla Geographic Origin of All Students - Fall 2007 ALASKA WASHINGTON 62 MAINE NORTH DAKOTA MINNESOTA MONTANA 4 1 OREGON VT 18 3 2 WISCONSIN NH 5 13 IDAHO 12 SOUTH DAKOTA 3 MA 15 5 NEW YORK CT MICHIGAN WYOMING 2 16 5 2 PENNSYLVANIA IOWA 12 NEVADA 26 NEBRASKA NJ OHIO 43 5 IN UTAH ILLINOIS 18 15 10 395 WV 4 COLORADO VIRGINIA 16 4 DC 2 KANSAS 20 12 MISSOURI 137 KENTUCKY CALIFORNIA 4,321 17 59 NO. CAROLINA TENNESSEE 5 59 ARIZONA OKLAHOMA ARKANSAS NEW MEXICO 12 61 5 3 MS GEORGIA ALABAMA 8 11 12 LA TEXAS 13 110 3 12 FL All Students, Totals United States 5,605 Other Countries 564 Total 6,167 Armed Forces Pacific & Africa 3 HAWAII 1 PUERTO RICO 1 Note: Geographic Origin is defined as student's legal residence at time of original admission to UMR. Source: Integrated Postsecondary Education Data System (IPEDS) frozen files, end of 4th week of classes. Revised 9-24-2007.
Maintaining HighAcademic Quality Ave. Freshmen ACT ScoreGoal: Maintain Ave ACT in Top 10%
Advancing ExcellenceCapital Campaign Progressin dollars and months
Campaign ProgressAs of November 30, 2007 millions Goal
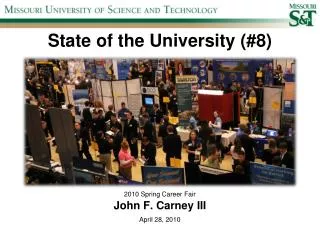
Career Opportunities Center • 286 employers at the 2007 Fall Career Fair • largest career fair in UMR history • Over 800 recruiters participated • over 3,200 students participated • 36 states were represented • 113 employers from Missouri • 228 employers at the 2007 Spring Career Fair • Career Center ranked 20th in the nation by Princeton Review “Best Career/Job Placement Services”
Student Design Teams • Human Powered Vehicle • National Champions • Baja Team • First Place in East Coast Mud Bog • First Responder Design Team • Top prize in Helicopter design competition • Chemical Reaction-Powered Autonomous Vehicle Team • First Place in Regional Competition • Women’s Mucking Team • World Championship
Human Powered Vehicle National Champions!
2007 Projects Solola, Guatemala Santiago, Honduras Rio Colorado, Bolivia Inka Katurapi, Bolivia 2008 Projects Solola, Guatemala Santiago, Honduras Engineers Without Borders
2007 Gala
Office ofSponsored Programs • FY08 proposal activities through October 2007 • Proposals awarded: $19.18M (up 51%) • Proposals submitted: $63.26M (up 100%) • Research expenditures: $13.26M (up 16%) • F&A recovered: $2M (up 10%)
Mechanical and Aerospace Engineering Building Construction Timeline • New construction May 2008 completion • Renovation of existing 12-15 months space • Project completion date Summer 2009
Residential College II • Opened June 17 with 3 summer camps: Explosives, Jackling Introduction to Engineering, and Mite2 • A total of 143 kids
Construction of the Tech Park / Incubator at the University of Missouri – Rolla will cost $128.0 million to build, with $42.0 million in equipment. Over 12 years, this project returns: • $43.39 million in general revenues to Missourians • $822.24 million in new personal income to Missourians • $842.81 million in new value-added / gross state produce to the economy • $997.02 million in new economic activity / output to the state economy On average each year, the project creates: • 1,026 new jobs annually paying an average wage of $41,644 per job • $ 3.6 million in general revenues on average each year • $68.5 million in new personal income on average each year • $70.2 million in new value-added / GSP on average each year • $83.1 million in new economic activity / output on average each year
University Technology Center • 31,000 ft2 – located on 10th Street within Innovation Park – east edge of the Park • St. Louis developer proposes build and lease space to University related technology companies • Pending final agreement with developer and land lease approval by The Board of Curators
Tech Transfer Performance Measures • Disclosures received • Patent applications filed • Patents issued • License/options signed • Licensing income Keith Strassner, Director Office of Technology and Economic Development
Strategic Plan • Tactical Plan • Higher Learning Commission Accreditation Self-Study • State Appropriations
Universe of Technological Research Universities Average enrollment is 6,457 Average enrollment is 5,615 Average enrollment = 5,801
Technological Research Universities • Quality Indicators • ACT 75th percentile • First-year students from top 10% of HS Class • First-to-second year retention rate • Six-year graduation rate • National merit scholars • National academy members • Total research expenditures per faculty • Ph.D’s awarded per faculty • Ratio of doctoral degrees to graduate degrees • Student faculty ratio
Rankings Combined Rank Mean • Massachusetts Institute of Technology 1.2 1 • California Institute of Technology 2.3 2 • Rensselaer Polytechnic Institute 3.8 3 • Georgia Institute of Technology 4.3 4 • University of Missouri-Rolla 7.2 5 • Stevens Institute of Technology 8.2 6 • Colorado School of Mines 8.5 7 • Worcester Polytechnic Institute 8.8 8 • Illinois Institute of Technology 9.6 9 • Clarkson University 10.0 10 • New Mexico Inst of Mining & Technology 10.0 11 • Polytechnic University 10.5 12 • Michigan Technological University 10.6 13 • New Jersey Institute of Technology 11.0 14 • Florida Institute of Technology 11.5 15 • South Dakota School of Mines & Technology 12.2 16
Missouri School of Mines and Metallurgy – 1870 • University of Missouri-Rolla – 1964 • Missouri University of Science and Technology (Missouri S&T) - 2008
Where do we go from here?
What are the two most critical technological problems facing the United States and the World?
Energy and the Environment =’s Civilization
Energy Facts • The U.S. spends over $500 billion dollars annually on energy. • Oil imports account for 55 percent of total U.S. consumption, up from 42 percent in 1990. • Energy demand is projected to rise by over 30 percent by 2020, much faster than the projected increase in domestic energy production.
U.S. National Energy Policy Key goals of the recent U.S. Department of Energy Comprehensive Energy Strategy include: • Diversify America’s energy supply by: • Promoting alternate and renewable sources of energy • Encouraging the expansion of nuclear energy in a safe and secure manner • Increasing domestic production of conventional fuels, and • Investing in science and technology. • Modernize the electric power infrastructure • Expand strategic petroleum reserves
Our University is uniquely qualified to tackle these critically important technological issues. • Our research areas include all phases of the energy supply and demand system: • Transportation and transportation fuels • Nuclear energy • Energy production from clean coal, biomass, unconventional oil and natural gas, wind, and the sun
We are the only University in the United States that has over 90% of its student body majoring in engineering, the sciences, mathematics, or business. • We are the only University in the United States that has 16 different engineering bachelor degree programs. • We are the only University in the United States that offers degree programs in Environmental Engineering, Geological Engineering, Geology and Geophysics, Mining Engineering, Nuclear Engineering, and Petroleum Engineering.
Some CurrentResearch Activities • Energy and Environment • H2 Fuels in Transportation and “Show Me the Road to Hydrogen • Agricultural Waste to Energy • Alternative Fuels Production • Algae Produced Biofuels • Wind Turbine Power • Hybrid (wind and solar) systems • Grid Reliability with Distributed Energy and Storage • Solar-Power Street Lighting • Solid Oxide Fuel Cell Development • Phytoremediation and Natural Treatment Systems • Coal Combustion Products • Greener Engines
Some CurrentResearch Activities • Green materials and processes • Solid Oxide Fuel Cell Materials • Improving Steel Industry Energy Efficiency • Geological Sequestration of CO2 • Life Cycle Greenhouse Gas Emission Comparison • Development of environmentally friendly coatings • Bio-Based renewable building materials • Recycled materials
Some CurrentResearch Activities • The Built World • Drinking Water Testing and Treatment Methods • Lead in Drinking Water Research • EMS Systems Development • Global Air Contamination • Indoor air pollution
Some CurrentResearch Activities • Impacts on Our Environment and Society • Biodevelopment Impacts and Bioinformatics • Toxicity of Nanoparticles in the Environment • Extremeophile Discovery
Energy Research and Development Center Director Mariesa L. Crow, Ph.D., P.E. Fred W. Finley Distinguished Professor of Electrical Engineering