Download
1 / 17
170 likes | 288 Vues
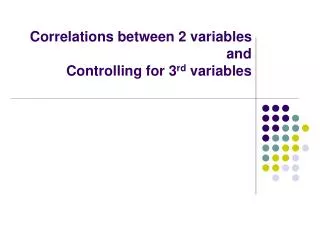
Adjusted analyses controlling for effects of other variables. Modeling of: Correlates of single HL variables and complex mix of lifestyle clusters in ‘high risk’ demographically defined groups from single risk factor correlates analysis. Full sample, adjusted ORs.

E N D
Adjusted analysescontrolling for effects of other variables Modeling of: Correlates of single HL variables and complex mix of lifestyle clusters in ‘high risk’ demographically defined groups from single risk factor correlates analysis
Full sample, adjusted ORs Self reported High BP is most strongly related to age Other independent correlates include : education Indigenous status Food insecurity
Full sample, adjusted ORs Risk [odds ratios] of alcohol dependent status declines with age And is higher among males, indigenous, European/Amer, high income and food insecurity
Full sample, adjusted ORs Being in highest F and V quintile is more likely among older adults, higher educated, high income
Full sample, adjusted ORs Current smoking less likely among older Adults, and more educated, And overseas born Higher risk among males Indigenous Unemployed And food insecurity
Groupings of ‘at risk’ HL clusters of unhealthy variables Summary AOR, including community belonging Mental health correlates and propensity for change eg. i] Overweight and inactive ii] overweight and inactive and smoker Are there consistent correlates of increasing risk profiles ?
Examples: Dyads/triads of clusters of risk factors, adjusted ORs, signif only
Define population segments – on the basis of risk factor profiles eg. i] young males <35 yrs ii] low education males Iii] middle aged low SES females Are there consistent correlates of demographic subgroups ? Are there any protective influences which can be identified ?