Download
1 / 1
30 likes | 153 Vues
Mapping Medline Papers, Genes, and Proteins Related to Melanoma Research. Kevin Boyack † , Ketan Mane ‡ , Katy B ö rner ‡ † VisWave LLC, Albuquerque, NM 87122. ‡ School of Library and Information Science, Indiana University, Bloomington, IN 47405.

E N D
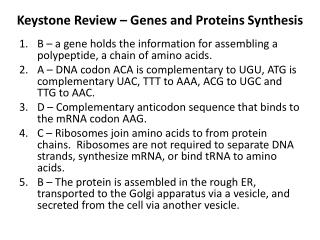
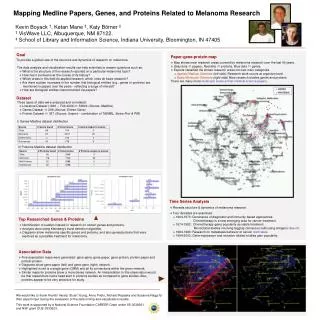
Mapping Medline Papers, Genes, and Proteins Related to Melanoma Research Kevin Boyack †, Ketan Mane ‡, Katy Börner ‡† VisWave LLC, Albuquerque, NM 87122.‡ School of Library and Information Science, Indiana University, Bloomington, IN 47405 • GoalTo provide a global view of the structure and dynamics of research on melanoma. • The data analysis and visualization results can help scientists to answer questions such as: • What is the structure of the research reported on a particular melanoma topic? • How has it evolved over the course of its history? • Which areas in this field do applied research, which ones do basic research? • Are there sudden increases in the number that biological entities (e.g., genes or proteins) are mentioned in papers over the years - reflecting a surge of interest? • How are biological entities interconnected via papers? Dataset Three types of data were analyzed and correlated: • Literature Dataset (1960 – Feb 2004) 53804 (Source: Medline) • Genes Dataset 299 (Source: Entrez-Gene) • Protein Dataset 367 (Source: Uniprot – combination of TrEMBL, Swiss-Prot & PIR) I) Genes-Medline dataset distribution • Paper-gene-protein map • Map shows main research areas covered by melanoma research over the last 40 years. • Gray dots papers, Red dots proteins, Blue dots genes. • Experts classified the shown research areas into two main categories > Applied Medical Sciences (left side): Research work occurs at organism level > Basic Molecular Sciences (right side) Most research studies genes and proteins There are many more molecular science than medical science papers. II) Proteins-Medline dataset distribution • Time Series Analysis • Reveals structure & dynamics of melanoma research. • Four decades are examined: > 1964-1973: Dominance of diagnostic and immunity based approaches. Chemotherapy is a new emerging area for cancer treatment. > 1974-1983: Chemotherapy gains popularity as viable treatment. Monoclonal studies involving tagging cancerous cells using antigens take off. > 1984-1993: Research on metastasis behavior of cancer dominates. > 1994-2003: Gene-expression and mutation related studies gain popularity. • Top Researched Genes & Proteins • Identification of sudden interest in research on certain genes and proteins. • Analysis done using Kleinberg’s burst detection algorithm. • Diagrams show melanoma specific genes and proteins, and also genes/proteins that were explored as a possible treatment for melanoma. • Association Data • Five association maps were generated: gene-gene, gene-paper, gene-protein, protein-paper and protein-protein. • Diagrams show gene-paper (left) and gene-gene (right) network. • Highlighted in red is a single gene (CMM) and all its connections within the given network. • Similar maps for proteins show a more dense network. An interpretation to this observation would be that researchers had a head start in proteins studies as compared to gene studies. Also, proteins appear to be very attractive for study. We would like to thank Kranthi Varala, Stuart Young, Anne Prieto, Richard Repasky and Susanne Ragg for their expert input during the evaluation of the data mining and visualization results. This work is supported by a National Science Foundation CAREER Grant under IIS-0238261 and NSF grant DUE-0333623.