Download
1 / 12
120 likes | 315 Vues
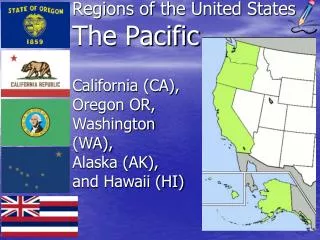
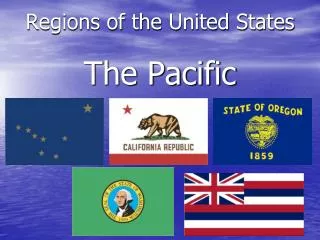
Understanding the State Legislature of the Pacific States. Bobby McInnis, Evan Bjorklund, Ben Krasnick, and Michael Linker. Number of Legislatures. CA: 1979 (1,760), 1988 (2,978), 1996 (2,610) 2003 (2,359) Hawaii: 1979 (485), 1988 (772), 1996 (742), 2003 (652)

E N D
Understanding the State Legislature of the Pacific States Bobby McInnis, Evan Bjorklund, Ben Krasnick, and Michael Linker
Number of Legislatures • CA: 1979 (1,760), 1988 (2,978), 1996 (2,610) 2003 (2,359) • Hawaii: 1979 (485), 1988 (772), 1996 (742), 2003 (652) • Oregon: 1979 (663), 1988 (557), 1996 (484), 2003 (465) • Washington: 1979 (920), 1988 (1,049), 1996 (902), 2003 (826)
Session Length • California: 1/4-8/31 • Hawaii: 1/18-early May • Oregon: No regular session length • Washington: 1/9-3/9
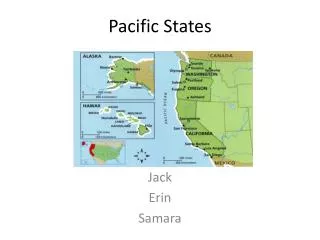
State Capital Buildings California Hawaii Oregon Washington
Salary and per diem for 2005 • California $110,880/year, $138.00/day • Hawaii $34,200/year ($35,000/year effective 2006), $80/day for members living outside Oahu; $10/day for members living on Oahu (V) set by the legislature. • Oregon $16,284/year, $91/day. Washington $34,227/year, $90/day.
Turnover Rate 2002: 1998: 1994-96:
Percentage of Time Spent Working As Legislator • California: 80%-100% • Hawaii: 70-80% • Oregon: 70-80% • Washington: 70-80%
Percentage Of Women Legislators • California: 30.8% • Hawaii: 30.2% • Oregon: 27.8% • Washington: 33.3%
Percentage of African American Legislators • California: 5.0% • Hawaii: 1.0% • Oregon: 3% • Washington: 2%
Term Limits • Of all Pacific states, term limits exist only in California • Formed in reaction to inability of legislature to deal with important issues. • Complexity of state issues Decline in 1966 – Professionalization of legislature • Term limits adopted in 1990, created new problems • Incumbent Politicians, legislative staff, bureaucrats, and interest groups are in opposition • 52.2% voted yes
Consequences of Term Limits - California • Highly organized, well funded coalition against term limits • Pros – “The experiment has proven largely successful.” • Crowded, competitive state primaries • Closer races • More incumbents defeated • More candidates • Legislature far more representative
Consequences cont. • Cons- • Overall, legislators lack the experience • Amendments on bills have increased dramatically • Leaders lack effectiveness • Makes “musical chairs” of political offices