Download
1 / 1
10 likes | 101 Vues
Garden Area Shaded by trees. 129th and Fifth Garden Width Air Temperature July 17, 2012 | 2:00 PM. Cooling the Community: Gardens to Mitigate the Heat Island Effect Alan Roditi, Lowell Brazin, Lauren Shum. 114 th and Pleasant. 129 th and Fifth. Abstract. Community Garden Study.

E N D
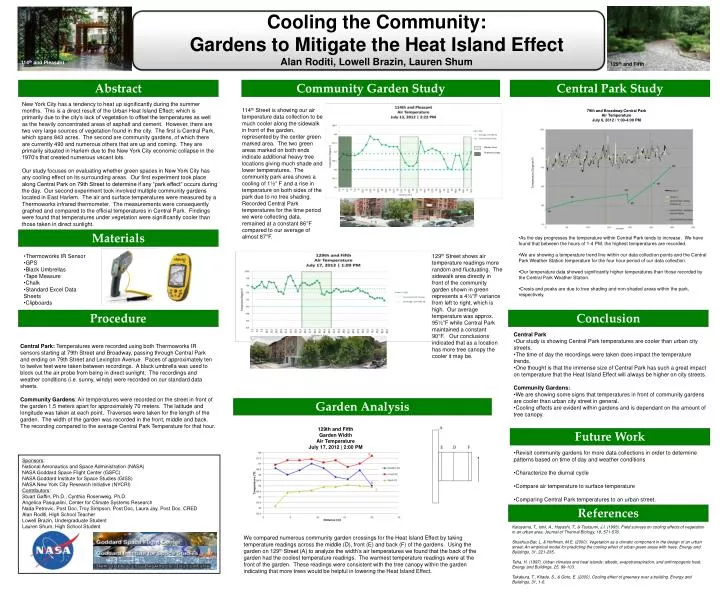
Garden Area Shaded by trees 129th and Fifth Garden Width Air Temperature July 17, 2012 | 2:00 PM Cooling the Community: Gardens to Mitigate the Heat Island Effect Alan Roditi, Lowell Brazin, Lauren Shum 114th and Pleasant 129th and Fifth Abstract Community Garden Study Central Park Study New York City has a tendency to heat up significantly during the summer months. This is a direct result of the Urban Heat Island Effect; which is primarily due to the city’s lack of vegetation to offset the temperatures as well as the heavily concentrated areas of asphalt and cement. However, there are two very large sources of vegetation found in the city. The first is Central Park, which spans 843 acres. The second are community gardens, of which there are currently 490 and numerous others that are up and coming. They are primarily situated in Harlem due to the New York City economic collapse in the 1970’s that created numerous vacant lots. Our study focuses on evaluating whether green spaces in New York City has any cooling effect on its surrounding areas. Our first experiment took place along Central Park on 79th Street to determine if any “park effect” occurs during the day. Our second experiment took involved multiple community gardens located in East Harlem. The air and surface temperatures were measured by a Thermoworks infrared thermometer. The measurements were consequently graphed and compared to the official temperatures in Central Park. Findings were found that temperatures under vegetation were significantly cooler than those taken in direct sunlight. 114th Street is showing our air temperature data collection to be much cooler along the sidewalk in front of the garden, represented by the center green marked area. The two green areas marked on both ends indicate additional heavy tree locations giving much shade and lower temperatures. The community park area shows a cooling of 1½° F and a rise in temperature on both sides of the park due to no tree shading. Recorded Central Park temperatures for the time period we were collecting data, remained at a constant 86°F compared to our average of almost 87°F. 79th and Broadway/Central Park Air Temperature July 6, 2012 / 1:00-4:00 PM Temperature (Degrees F) Materials • As the day progresses the temperature within Central Park tends to increase. We have found that between the hours of 1-4 PM, the highest temperatures are recorded. • We are showing a temperature trend line within our data collection points and the Central Park Weather Station temperature for the four hour period of our data collection. • Our temperature data showed significantly higher temperatures than those recorded by the Central Park Weather Station. • Crests and peaks are due to tree shading and non-shaded areas within the park, respectively. • Thermoworks IR Sensor • GPS • Black Umbrellas • Tape Measure • Chalk • Standard Excel Data Sheets • Clipboards 129th Street shows air temperature readings more random and fluctuating. The sidewalk area directly in front of the community garden shown in green represents a 4½°F variance from left to right, which is high. Our average temperature was approx. 95½°F while Central Park maintained a constant 90°F. Our conclusions indicated that as a location has more tree canopy the cooler it may be. Procedure Conclusion • Central Park • Our study is showing Central Park temperatures are cooler than urban city streets. • The time of day the recordings were taken does impact the temperature trends. • One thought is that the immense size of Central Park has such a great impact on temperature that the Heat Island Effect will always be higher on city streets. • Community Gardens: • We are showing some signs that temperatures in front of community gardens are cooler than urban city street in general. • Cooling effects are evident within gardens and is dependant on the amount of tree canopy. Central Park: Temperatures were recorded using both Thermoworks IR sensors starting at 79th Street and Broadway, passing through Central Park and ending on 79th Street and Lexington Avenue. Paces of approximately ten to twelve feet were taken between recordings. A black umbrella was used to block out the air probe from being in direct sunlight. The recordings and weather conditions (i.e. sunny, windy) were recorded on our standard data sheets. Community Gardens: Air temperatures were recorded on the street in front of the garden 1.5 meters apart for approximately 70 meters. The latitude and longitude was taken at each point. Traverses were taken for the length of the garden. The width of the garden was recorded in the front, middle and back. The recording compared to the average Central Park Temperature for that hour. Garden Analysis Future Work • Revisit community gardens for more data collections in order to determine patterns based on time of day and weather conditions • Characterize the diurnal cycle • Compare air temperature to surface temperature • Comparing Central Park temperatures to an urban street. Sponsors: National Aeronautics and Space Administration (NASA) NASA Goddard Space Flight Center (GSFC) NASA Goddard Institute for Space Studies (GISS) NASA New York City Research Initiative (NYCRI) Contributors: Stuart Gaffin, Ph.D., Cynthia Rosenweig, Ph.D. Angelica Pasqualini, Center for Climate Systems Research Nada Petrovic, Post Doc, Troy Simpson, Post Doc, Laura Jay, Post Doc, CRED Alan Roditi, High School Teacher Lowell Brazin, Undergraduate Student Lauren Shum, High School Student References Katayama, T., Ishii, A., Hayashi, T., & Tsutsumi, J.I. (1993). Field surveys on cooling effects of vegetation in an urban area. Journal of Thermal Biology, 18, 571-576. Shashua-Bar, L. & Hoffman, M.E. (2000). Vegetation as a climatic component in the design of an urban street: An empirical model for predicting the cooling effect of urban green areas with trees. Energy and Buildings, 31, 221-235. Taha, H. (1997). Urban climates and heat islands: albedo, evapotranspiration, and anthropogenic heat. Energy and Buildings, 25, 99-103. Takakura, T., Kitade, S., & Goto, E. (2000). Cooling effect of greenery over a building. Energy and Buildings, 31, 1-6. We compared numerous community garden crossings for the Heat Island Effect by taking temperature readings across the middle (D), front (E) and back (F) of the gardens. Using the garden on 129th Street (A) to analyze the width’s air temperatures we found that the back of the garden had the coolest temperature readings. The warmest temperature readings were at the front of the garden. These readings were consistent with the tree canopy within the garden indicating that more trees would be helpful in lowering the Heat Island Effect.