Common Mode Noise
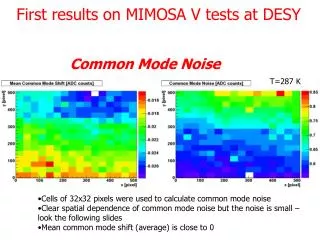
First results on MIMOSA V tests at DESY. Common Mode Noise. T=287 K. Cells of 32x32 pixels were used to calculate common mode noise Clear spatial dependence of common mode noise but the noise is small – look the following slides Mean common mode shift (average) is close to 0. Pedestals.

Common Mode Noise
E N D
Presentation Transcript
First results on MIMOSA V tests at DESY Common Mode Noise T=287 K • Cells of 32x32 pixels were used to calculate common mode noise • Clear spatial dependence of common mode noise but the noise is small – look the following slides • Mean common mode shift (average) is close to 0
Pedestals Pixel pedestal distribution Mean pedestal vs. temperature T of the coolant and not the detector is given There may be a systematic shift! • Error bars are RMS of the pixel pedestal distribution • fit function (good agreement) • Pedestal runs with 100 events were analyzed • Common mode subtracted • Asymmetrical distribution Fit parameters pedestals can be used to measure Ileak after irradiation Leakage current term
Noise Mean noise vs. temperature Pixel noise distribution T=287 K • Error bars are RMS of the pixel pedestal distribution and not the error of the mean • fit function - good agreement with expected behavior Fit parameters (p0,p1) Leakage current term
Signal from 55Fe 5.9 keV line Single pixel signal is required (neighbors without signal – escape g is not detected) 6.4 keV line HIT MAP Fe55 • Peak used to calibrate the noise ENC~30-35 • (LEPSI claims ~ 20 , but at what T ?) • Expected signal from m.i.p. are around 1000 e S/N~30 T=286 K – how much offset do we have? y [pixel] x [pixel]
106Ru – electrons Cluster Signal Cluster size distribution single pixel 3x3 array 5x5 array S/Nneig.=2 T=286 K Landau function fit • S/Ncluster~28 (close to that predicted from Fe X-source and noise) • small difference in most probable signal between 3x3 and 5x5 pixel arrays • Average cluster size ~ 6 • spectrum broader than for m.i.p.
Conclusions and Plans • We clearly have a working chip, however noise is 10e higher compared to that measured in Strasbourg. • Noise(T) and Pedestal(T) clearly resemble leakage current behavior • – what is actual T of the detector? • Common mode noise is small • Spectra look reasonable – but activity of 55Fe is too high – in the future we will use additional absorber • Migration to new PC • Analysis software is being developed by Pawel and Gregor. At the moment there is a temporary solution available • DAQ software will be addressed after analysis one is done