Download
1 / 82
860 likes | 1.25k Vues
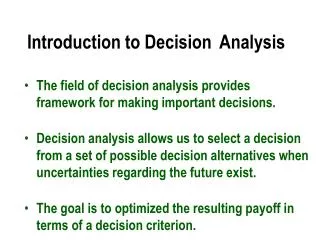
6.1 Introduction to Decision Analysis. The field of decision analysis provides a framework for making important decisions. Decision analysis allows us to select a decision from a set of possible decision alternatives when uncertainties regarding the future exist.

E N D
6.1 Introduction to Decision Analysis • The field of decision analysis provides a framework for making important decisions. • Decision analysis allows us to select a decision from a set of possible decision alternatives when uncertainties regarding the future exist. • The goal is to optimize the resulting payoff in terms of a decision criterion.
6.1 Introduction to Decision Analysis • Maximizing expected profit is a common criterion when probabilities can be assessed. • Maximizing the decision maker’s utility function is the mechanism used when risk is factored into the decision making process.
6.2 Payoff Table Analysis • Payoff Tables • Payoff table analysis can be applied when: • There is a finite set of discrete decision alternatives. • The outcome of a decision is a function of a single future event. • In a Payoff table - • The rows correspond to the possible decision alternatives. • The columns correspond to the possible future events. • Events (states of nature) are mutually exclusive and collectively exhaustive. • The table entries are the payoffs.
TOM BROWN INVESTMENT DECISION • Tom Brown has inherited $1000. • He has to decide how to invest the money for one year. • A broker has suggested five potential investments. • Gold • Junk Bond • Growth Stock • Certificate of Deposit • Stock Option Hedge
TOM BROWN • The return on each investment depends on the (uncertain) market behavior during the year. • Tom would build a payoff table to help make the investment decision
TOM BROWN - Solution • Select a decision making criterion, and apply it to the payoff table. • Construct a payoff table. • Identify the optimal decision. • Evaluate the solution.
DJA is up [+300,+1000] DJA is down [-300, -800] DJA is down more than 800 points DJA is up more than1000 points DJA moveswithin [-300,+300] • Define the states of nature. The Payoff Table The states of nature are mutually exclusive and collectively exhaustive.
Determine the set of possible decision alternatives. The Payoff Table
-150 -150 The Payoff Table -100 250 200 150 The stock option alternative is dominated by the bond alternative
6.3 Decision Making Criteria • Classifying decision-making criteria • Decision making under certainty. • The future state-of-nature is assumed known. • Decision making under risk. • There is some knowledge of the probability of the states of nature occurring. • Decision making under uncertainty. • There is no knowledge about the probability of the states of nature occurring.
Decision Making Under Uncertainty • The decision criteria are based on the decision maker’s attitude toward life. • The criteria include the • Maximin Criterion - pessimistic or conservative approach. • Minimax Regret Criterion - pessimistic or conservative approach. • Maximax Criterion - optimistic or aggressive approach. • Principle of Insufficient Reasoning – no information about the likelihood of the various states of nature.
Decision Making Under Uncertainty - The Maximin Criterion • This criterion is based on the worst-case scenario. • It fits both a pessimistic and a conservative decisionmaker’s styles. • A pessimistic decision maker believes that the worst possible result will always occur. • A conservative decision maker wishes to ensure a guaranteed minimum possible payoff.
The optimal decision TOM BROWN - The Maximin Criterion • To find an optimal decision • Record the minimum payoff across all states of nature for each decision. • Identify the decision with the maximum “minimum payoff.”
=MAX(H4:H7) =MIN(B4:F4) Drag to H7 * FALSE is the range lookup argument in the VLOOKUP function in cell B11 since the values in column H are not in ascending order =VLOOKUP(MAX(H4:H7),H4:I7,2,FALSE) The Maximin Criterion - spreadsheet
Cell I4 (hidden)=A4 Drag to I7 The Maximin Criterion - spreadsheet I4 To enable the spreadsheet to correctly identify the optimal maximin decision in cell B11, the labels for cells A4 through A7 are copied into cells I4 through I7 (note that column I in the spreadsheet is hidden).
Decision Making Under Uncertainty - The Minimax Regret Criterion
Decision Making Under Uncertainty - The Minimax Regret Criterion • The Minimax Regret Criterion • This criterion fits both a pessimistic and a conservative decision maker approach. • The payoff table is based on “lost opportunity,” or “regret.” • The decision maker incurs regret by failing to choose the “best” decision.
Decision Making Under Uncertainty - The Minimax Regret Criterion • The Minimax Regret Criterion • To find an optimal decision, for each state of nature: • Determine the best payoff over all decisions. • Calculate the regret for each decision alternative as the difference between its payoff value and this best payoff value. • For each decision find the maximum regret over all states of nature. • Select the decision alternative that has the minimum of these “maximum regrets.”
Decision Making Under Uncertainty - The Maximax Criterion • This criterion is based on the best possible scenario.It fits both an optimistic and an aggressive decision maker. • An optimistic decision maker believes that the best possible outcome will always take place regardless of the decision made. • An aggressive decision maker looks for the decision with the highest payoff (when payoff is profit).
Decision Making Under Uncertainty - The Maximax Criterion • To find an optimal decision. • Find the maximum payoff for each decision alternative. • Select the decision alternative that has the maximum of the “maximum” payoff.
The optimal decision TOM BROWN -The Maximax Criterion
Decision Making Under Uncertainty - The Principle of Insufficient Reason • This criterion might appeal to a decision maker who is neither pessimistic nor optimistic. • It assumes all the states of nature are equally likely to occur. • The procedure to find an optimal decision. • For each decision add all the payoffs. • Select the decision with the largest sum (for profits).
TOM BROWN - Insufficient Reason • Sum of Payoffs • Gold 600 Dollars • Bond 350 Dollars • Stock 50 Dollars • C/D 300 Dollars • Based on this criterion the optimal decision alternative is to invest in gold.
Decision Making Under Risk • The probability estimate for the occurrence ofeach state of nature (if available) can be incorporated in the search for the optimal decision. • For each decision calculate its expected payoff.
Decision Making Under Risk –The Expected Value Criterion • For each decision calculate the expected payoff as follows: (The summation is calculated across all the states of nature) • Select the decision with the best expected payoff Expected Payoff = S(Probability)(Payoff)
The optimal decision TOM BROWN -The Expected Value Criterion EV = (0.2)(250) + (0.3)(200) + (0.3)(150) + (0.1)(-100) + (0.1)(-150) = 130
When to use the expected value approach • The expected value criterion is useful generally in two cases: • Long run planning is appropriate, and decision situations repeat themselves. • The decision maker is risk neutral.
Cell H4 (hidden) = A4 Drag to H7 =SUMPRODUCT(B4:F4,$B$8:$F$8) Drag to G7 =MAX(G4:G7) =VLOOKUP(MAX(G4:G7),G4:H7,2,FALSE) The Expected Value Criterion - spreadsheet
6.4 Expected Value of Perfect Information • The gain in expected return obtained from knowing with certainty the future state of nature is called: Expected Value of Perfect Information (EVPI)
Stock TOM BROWN -EVPI If it were known with certainty that there will be a “Large Rise” in the market -100 250 500 60 Large rise ... the optimal decision would be to invest in... Similarly,…
-100 250 500 60 TOM BROWN -EVPI Expected Return with Perfect information = ERPI = 0.2(500)+0.3(250)+0.3(200)+0.1(300)+0.1(60) = $271 Expected Return without additional information = Expected Return of the EV criterion = $130 EVPI = ERPI - EREV = $271 - $130 = $141
6.5 Bayesian Analysis - Decision Making with Imperfect Information • Bayesian Statistics play a role in assessing additional information obtained from various sources. • This additional information may assist in refining original probability estimates, and help improve decision making.
When the stock market showed a large rise the Forecast predicted a “positive growth” 80% of the time. TOM BROWN – Using Sample Information • Tom can purchase econometric forecast results for $50. • The forecast predicts “negative” or “positive” econometric growth. • Statistics regarding the forecast are: Should Tom purchase the Forecast ?
TOM BROWN – SolutionUsing Sample Information • If the expected gain resulting from the decisions made with the forecast exceeds $50, Tom should purchase the forecast. The expected gain = Expected payoff with forecast – EREV • To find Expected payoff with forecast Tom should determine what to do when: • The forecast is “positive growth”, • The forecast is “negative growth”.
TOM BROWN – SolutionUsing Sample Information • Tom needs to know the following probabilities • P(Large rise | The forecast predicted “Positive”) • P(Small rise | The forecast predicted “Positive”) • P(No change | The forecast predicted “Positive ”) • P(Small fall | The forecast predicted “Positive”) • P(Large Fall | The forecast predicted “Positive”) • P(Large rise | The forecast predicted “Negative ”) • P(Small rise | The forecast predicted “Negative”) • P(No change | The forecast predicted “Negative”) • P(Small fall | The forecast predicted “Negative”) • P(Large Fall) | The forecast predicted “Negative”)
P(B|Ai)P(Ai) P(B|A1)P(A1)+ P(B|A2)P(A2)+…+ P(B|An)P(An) P(Ai|B) = Posterior Probabilities Probabilities determined after the additional info becomes available. Prior probabilities Probability estimates determined based on current info, before the new info becomes available. TOM BROWN – SolutionBayes’ Theorem • Bayes’ Theorem provides a procedure to calculate these probabilities
The Probability that the forecast is “positive” and the stock market shows “Large Rise”. TOM BROWN – SolutionBayes’ Theorem • The tabular approach to calculating posterior probabilities for “positive” economical forecast = X
0.16 0.56 = X The probability that the stock market shows “Large Rise” given that the forecast is “positive” TOM BROWN – SolutionBayes’ Theorem • The tabular approach to calculating posterior probabilities for “positive” economical forecast
= X Observe the revision in the prior probabilities TOM BROWN – SolutionBayes’ Theorem • The tabular approach to calculating posterior probabilities for “positive” economical forecast Probability(Forecast = positive) = .56
TOM BROWN – SolutionBayes’ Theorem • The tabular approach to calculating posterior probabilities for “negative” economical forecast Probability(Forecast = negative) = .44
Expected Value of Sample InformationEVSI • This is the expected gain from making decisions based on Sample Information. • Revise the expected return for each decision using the posterior probabilities as follows:
TOM BROWN – Conditional Expected Values • EV(Invest in……. |“Positive” forecast) = =.286( )+.375( )+.268( )+.071( )+0( ) = • EV(Invest in ……. | “Negative” forecast) = =.091( )+.205( )+.341( )+.136( )+.227( ) = GOLD -100 100 $84 200 300 0 GOLD -100 100 200 300 0 $120
If the forecast is “Positive” Invest in Stock. If the forecast is “Negative” Invest in Gold. TOM BROWN – Conditional Expected Values • The revised expected values for each decision: Positive forecastNegative forecast EV(Gold|Positive) = 84 EV(Gold|Negative) = 120 EV(Bond|Positive) = 180 EV(Bond|Negative) = 65 EV(Stock|Positive) = 250 EV(Stock|Negative) = -37 EV(C/D|Positive) = 60 EV(C/D|Negative) = 60
TOM BROWN – Conditional Expected Values • Since the forecast is unknown before it is purchased, Tom can only calculate the expected return from purchasing it. • Expected return when buying the forecast = ERSI = P(Forecast is positive)·(EV(Stock|Forecast is positive)) + P(Forecast is negative”)·(EV(Gold|Forecast is negative)) = (.56)(250) + (.44)(120) = $192.5
Expected Value of Sampling Information (EVSI) • The expected gain from buying the forecast is: EVSI = ERSI – EREV = 192.5 – 130 = $62.5 • Tom should purchase the forecast. His expected gain is greater than the forecast cost. • Efficiency = EVSI / EVPI = 63 / 141 = 0.45
6.6 Decision Trees • The Payoff Table approach is useful for a non-sequential or single stage. • Many real-world decision problems consists of a sequence of dependent decisions. • Decision Trees are useful in analyzing multi-stage decision processes.