Print Industry Challenges & Profit Trends Workshop
750 likes | 851 Vues
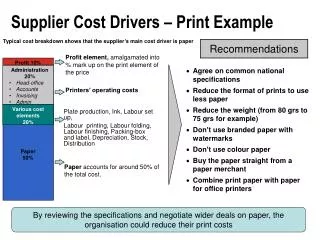
Understand industry challenges, cost behavior, allocation methods, and profit trends in the print industry for enhanced profitability. Gain insights and strategies for managing costs effectively.

Print Industry Challenges & Profit Trends Workshop
E N D
Presentation Transcript
PANPA Print Cost Technical Workshop Nigel Finch Director, Centre for Managerial Finance Macquarie Graduate School of Management (MGSM)
Agenda • Industry Challenges & Profit Trends • Cost Behaviour & Type • Cost Allocation Methods & Limitations • Activity Based Costing (ABC) • The Cost of Capacity & Pricing • Recommendations
A daunting array of challenges... The print industry is a mature industry and as such will likely grow at a slower rate than the overall economy. The industry still remains highly fragmented, and suffers from chronic overcapacity, and intense competition. Rapid technological improvements demand larger and more frequent capital investments. New media and communications platforms are challenging the primacy of commercially printed materials.
A daunting array of challenges... Coupled with other economic factors, these challenges converge to place print industry profits under constant pressure. To remain competitive in this environment, and maintain profitability, it is crucial to have a clear picture of thereal economic cost for producing print jobs, providing other ancillary services, and servicing individual customers needs.
USA study – profit margin Printing Industries of America (PIA) conducted a broad cross section study of financial performance of U.S. firms. The sample was categorised into different groups based on operational diversity (such as volumes, geography, product speciality and manufacturing process). Within each group, firms were rated as either “profit leaders” or “profit laggers” based on pre-tax profitability. Over a ten-year period average profit leaders earned 9.7%, and profit laggers earned 0.7%.
Dodd, Lavelle & Margolis, (2002), "Driving Improved Profitability With Activity-Based Costing", Point Balance Publishing, Philadelphia.
Profit leaders vs. profit laggers So what distinguishes a profit leader from a profit lagger? One significant financial characteristic is that, on average, they spend fewer dollars on support expenses for each dollar of revenue. Support expenses include overheads but exclude direct production costs, interest and depreciation.
Analysis of support costs (% of sales) Adapted from Printing Industries of America, "2001 PIA Ratios: Management Guide to the PIA Ratios", Vol. 1, Printing Industries of America, Virginia,
Questioning support expenses How do profit leaders gain control of support expenses to achieve superior financial performance? Are some support expenses more important than others? What activities and processes are responsible for generating and consuming support expenses? How much does it cost to perform each of these activities and processes? Gaining visibility into support expenses is therefore critical to managing and improving profitability.
Understanding Cost Behavior – TOTAL Cost FIXED COSTS VARIABLE COSTS Total Cost $ Total Cost $ Quantity Quantity
Understanding Cost Behavior – TOTAL Cost FIXED COSTS VARIABLE COSTS Total Cost $ Total Cost $ Quantity Quantity
Understanding Cost Behavior – TOTAL Cost FIXED COSTS VARIABLE COSTS Total Cost $ Total Cost $ Quantity Quantity
Understanding Cost Behavior – TOTAL Cost FIXED COSTS VARIABLE COSTS Total Cost $ Total Cost $ Quantity Quantity Total amount of fixed costs remains constant over the period, irrespective of changes in quantity
Understanding Cost Behavior – TOTAL Cost FIXED COSTS VARIABLE COSTS Total Cost $ Total Cost $ Quantity Quantity Total amount of fixed costs remains constant over the period, irrespective of changes in quantity
Understanding Cost Behavior – TOTAL Cost FIXED COSTS VARIABLE COSTS Total Cost $ Total Cost $ Quantity Quantity Total amount of fixed costs remains constant over the period, irrespective of changes in quantity
Understanding Cost Behavior – TOTAL Cost FIXED COSTS VARIABLE COSTS Total Cost $ Total Cost $ Quantity Quantity Total amount of variable costs increases in proportion to changes in quantity Total amount of fixed costs remains constant over the period, irrespective of changes in quantity
Understanding Cost Behavior – UNIT Cost VARIABLE COSTS FIXED COSTS Unit Cost $ Unit Cost $ Quantity Quantity
Understanding Cost Behavior – UNIT Cost VARIABLE COSTS FIXED COSTS Unit Cost $ Unit Cost $ Quantity Quantity
Understanding Cost Behavior – UNIT Cost VARIABLE COSTS FIXED COSTS Unit Cost $ Unit Cost $ Quantity Quantity
Understanding Cost Behavior – UNIT Cost VARIABLE COSTS FIXED COSTS Unit Cost $ Unit Cost $ Quantity Quantity Cost per unit decreases as quantity increases
Understanding Cost Behavior – UNIT Cost VARIABLE COSTS FIXED COSTS Unit Cost $ Unit Cost $ Quantity Quantity Cost per unit decreases as quantity increases
Understanding Cost Behavior – UNIT Cost VARIABLE COSTS FIXED COSTS Unit Cost $ Unit Cost $ Quantity Quantity Cost per unit decreases as quantity increases
Understanding Cost Behavior – UNIT Cost VARIABLE COSTS FIXED COSTS Unit Cost $ Unit Cost $ Quantity Quantity Cost per unit is constant irrespective of changes in quantity Cost per unit decreases as quantity increases
Understanding Cost Behavior FIXED COSTS VARIABLE COSTS FIXED COSTS VARIABLE COSTS Total Cost $ Total Cost $ Unit Cost $ Unit Cost $ Quantity Quantity Quantity Quantity
Understanding Cost Behavior FIXED COSTS VARIABLE COSTS FIXED COSTS VARIABLE COSTS Total Cost $ Total Cost $ Unit Cost $ Unit Cost $ Quantity Quantity Quantity Quantity
Direct Costs vs. Indirect Costs Direct costs are costs that can be traced back to a product. Indirect costs are costs that a common to many products. Indirect costs cannot be traced, rather they must be allocated (guessed) to each product. Indirect costs are also called overhead e.g.support expenses. Total cost = Direct costs + Indirect cost
Total Cost Total Cost∑
Total Cost Total Cost∑ +
Total Cost = Direct + Indirect Total Cost∑ +
Total Cost Total Cost∑
Total Cost Total Cost∑ +
Total Cost = Fixed + Variable Total Cost∑ +
Cost Certainty Fixed cost per unit is unknown as it is a function of quantity
Cost Certainty Fixed cost per unit is unknown as it is a function of quantity Indirect cost per unit is unknown and is based solely on allocation
Cost Certainty In determining cost per unit, direct variable cost is the only cost type that can be known with certainty.
How we understand total cost = + Direct Cost Indirect Cost Total Cost Traceable Allocated Estimated
Cost allocation methodology Most of the features seen in today’s cost accounting systems were established in the 1930s. While the business environment has undergone dramatic change since the 1970s, very little change has occurred in the fundamental principles used in estimating cost (and price). The basic premise in business is to sell at a price above cost. To determine cost (and hence set price), two approaches are generally used – direct cost and absorption cost. Lockamy A., (2003), "A constraint-based framework for strategic cost management", Industrial Management & Data Systems, 103(8), pp. 591 – 599.
Direct cost vs. Absorption cost Under direct costing, direct cost margins will accumulate to build up the necessary contribution to pay overheads before taking account of profit. For example in setting price we might approach it using the adage “people, paper and profit”. However, this assumes that jobs with a high proportion of direct costs consume an equally high proportional amount of indirect costs. Q: Does printing on thicker stock consume more rent?
Direct cost vs. Absorption cost Under absorption costing, an allocation of indirect costs is added to the direct costs for each job. A mark up is then added to the total cost to arrive at a price, say cost plus 30%. Absorption costing relies upon an allocation methodology to apportion an amount of indirect cost to each job. In principle this is a “user-pays” system. Understanding this methodology is critical to understanding the reliability of the cost estimate.
Cost allocation methodology Under absorption costing, the proportion of indirect costs added to each job is based on the formula: Estimated cost / Estimated activity Estimated activity is generally defined as the planned activity of the cost driver. A cost driver is an event associated with an activity that results in the consumption of the firm’s resources, for example labour hours.
Cost allocation methodology General Ledger Budget Estimated Overhead Estimated cost divided by Estimated activity Estimated Labour Hours Overhead per Labour Hour
Why budgeted hourly rates are inadequate Most firms use a Budgeted Hourly Rate (BHR) model to estimate costs, however BHR has 3 major limitations. Firstly, there is no attempt to identify or define support activities, nor does it trace or assign costs to support activities. By ignoring these support activities BHR systems make it impossible to see what activities and processes are causing support expenses to exist. Without visibility into cost, there is no way to prioritise initiatives aimed at process improvement.