Download
1 / 44
440 likes | 600 Vues
A Measurement of the Ultra-High Energy Cosmic Ray Flux with the HiRes FADC Detector. PhD Defense Presentation September 15th, 2004 Andreas Zech. Outline. A Brief Introduction to UHECR Physics The HiRes Experiment Unfolding the Cosmic Ray Spectrum Results of the HiRes-2 Analysis

E N D
A Measurement of the Ultra-High Energy Cosmic Ray Flux with the HiRes FADC Detector PhD Defense Presentation September 15th, 2004 Andreas Zech
Outline • A Brief Introduction to UHECR Physics • The HiRes Experiment • Unfolding the Cosmic Ray Spectrum • Results of the HiRes-2 Analysis • Conclusions
A Brief Introduction to Ultra-High Energy Cosmic Ray Physics
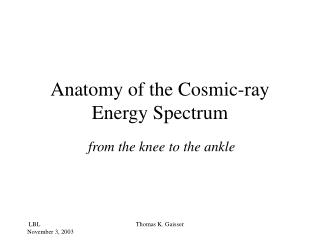
knee ankle second knee Energy Spectrum • differential flux: dN / (dE A Ω dt) • follows roughly E-3 power law • direct observation not possible above 1 PeV • three features: • ‘knee’ at ~1015.5 eV • ‘2nd knee’ (~ 1017.5 eV) • ‘ankle’ at ~1018.5 eV
Extensive Air Showers main channels: π+(-)μ+(-) +νμ ( νμ ) πo 2 γ main e.m. processes: • bremsstrahlung • pair production • ionization
HiRes/MIA & HR stereo Composition. HiRes-2 Composition Preliminary HiRes-2 Composition Measurement • Indirect Composition Measurement using depth of the shower maximum. • Shift from heavy to light composition at around 1017 eV to 1018 eV.
HiRes-2 Skymap • UHECR arrival directions agree with isotropic distribution. • AGASA claims to see small-scale anisotropies (clusters of events) at ultra-high energies.
Propagation Effects • magnetic fields (galactic, extragalactic) • red-shifting • e+e-- pair production with CMBR (at ~ 1017.8 eV) • photo-spallation of cosmic ray nuclei • GZK effect with CMBR (at ~ 1019.8 eV) γ (2.7 K) + p Δ(1232) π+ + n γ (2.7 K) + p Δ(1232) πo + p Strong flux suppression for extra-galactic sources.
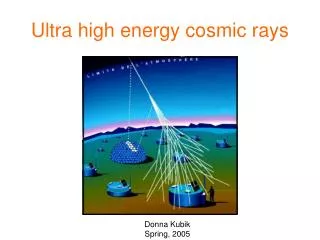
Fly’s Eye Air Fluorescence Detectors • Detection of longitudinal shower profile via UV fluorescence light. • Reconstruction of geometry from recorded shower ‘track’. • Using the atmosphere as a calorimeter.
HiRes-1 consists of one ring of 22 mirrors. Coverage in elevation is from 3 to 17 deg. Sample & Hold Electronics are used to record pulses. (5.6 μs window) HiRes-2 has two rings of 21 mirrors each. Coverage in elevation from 3 to 31 deg. Flash ADC electronics record signals at a frequency of 10 MHz.
Mirror area ~ 5 m^2 . • 256 (16x16) PMT per mirror. • One PMT sees ~ 1 degree of the sky.
1. Reconstruction of the shower-detector plane • project signal tubes onto sky • fit tube positions to a plane through the center of the detector • reject tubes that are off-track (and off in time) as noise • => shower axis lies in the fitted shower-detector plane
2. Reconstruction of the geometry within the s-d-plane(HiRes-2)
Reconstruct charged particle profile from recorded p.e. Fit profile to G.H. function. Subtract Čerenkov light. Multiply by mean ionization loss rate =>calorimetric energy Add ‘missing energy’ (muons, neutrinos, nuclear excitations; ~10%) => total energy 3. Shower Profile & Energy Reconstruction
Relative calibration at the beginning and end of each nightly run. using YAG laser. optical fibers distribute the laser signal to all mirrors. Conversion of recorded FADC signals to photon flux. Absolute calibration using a portable light-source (“RXF”) of known intensity that is carried to both sites. Phototube Calibration
attenuation of light by two main processes: Rayleigh (molecular) scattering Mie (aerosol) scattering Rayleigh contribution is quite stable and well known. Aerosol profile of the atmosphere has to be monitored during the run. Monitoring with an array of vertical Xenon flashers between the two detector sites. Detailed monitoring with steerable lasers on both sites. Additional vertical laser outside of Dugway (Terra). Atmospheric Calibration
Atmospheric Database Atmospheric data of the selected nights in this analysis: <HAL> = 27 km <VAOD> = 0.035
We observe the spectrum convoluted with detector acceptance and limited resolution. Deconvolution with help of a correction factor: D(Ei)=Σ Rij T(Ej) T(Ei)= [Gmc(Ei)/Rmc(Ei)] D(Ei) We need M.C. to simulate acceptance (& resolution)of our detectors for the flux measurement: This requires a simulation program that describes the shower development and detector response as realistically as possible. Deconvolution of the UHECR Spectrum
Gaisser-Hillas fit to the shower profile: Fit parameters scale with primary energy: CORSIKA Shower Library (proton & iron)
Data / Monte Carlo Comparisons Testing how well we simulate our experiment... • HiRes-2 data shown from 12/99 until 09/01. • ~ 531 hours of good weather data. • average atmosphere used for consistency with HiRes-1. • Statistics: • rec. geometry: 6262 events • after all cuts: 2666events • M.C. : ~ 5 x data statistics
σ = 18 % Energy Distribution & Resolution
Rmc(Ei) / Gmc(Ei) Acceptances from simulations broken up into 3 datasets. Acceptances & Exposure A* Ω * t * Rmc(Ei) / Gmc(Ei) ‘Smoothed’ exposure (in 104 km2 sr s).
Systematic Uncertainties Systematic uncertainties in the energy scale: • absolute calibration of phototubes: +/- 10 % • fluorescence yield: +/- 10 % • correction for ‘misssing’ energy: +/- 5 % • aerosol concentration: < 6 % => uncertainty in energy scale: +/- 16 % + atmospheric uncertainty in aperture => total uncertainty in the flux: +/- 31 % What are the uncertainties due atmospheric variations and due to the MC input composition ?
Systematics due to MC Input Composition • Detector acceptance at low energies depends on c.r. composition. • MC uses HiRes/MIA measurement as input composition. • Relevant uncertainties : • detector calibration • atmosphere • fit to HiRes/MIA data => +/-5 % uncertainty in proton fraction
spectrum with database spectrum with average Systematics due to Atmospheric Variations • Repeated HiRes-2 analysis using the atmospheric database. • Regular Analysis: • <HAL>=25 km, <VAOD>=0.04 • in MC generation • in data & MC reconstr. • Systematics Check: • HAL & VAOD from database (hourly entries) • in MC generation • in data & MC reconstr.
Fits to the HiRes-2 Spectrum J ~ E -3.33+/-0.01 J ~ E -2.81+/-0.02
Extragalactic Galactic Spectrum Fit • Fit to the HiRes monocular spectra assuming • galactic & extragalactic components • all propagation effects (e+e-, red-shift, GZK) • Details of the fit procedure • Float normalization, input spectral slope (g) and m • Extragalactic component • 45% protons at 1017 eV • 80% protons at 1017.85 eV • 100% protons at 1020 eV • Use binned maximum likelihood method
We have measured the UHECR spectrum from 1017.2 eV to the highest energies with HiRes-2 in monocular mode. • A simulation of the exact data taking conditions was used to determine the acceptance and resolution of the detector. • The simulation was tested in detailed data-MC comparisons and proven to be realistic. • Systematic uncertainties due to atmospheric variations and MC input composition were shown to be small.
We observe the ‘ankle’ in the HiRes-2 spectrum at 1018.5 eV. • The HiRes-2 result is in close agreement with HiRes-1 and Fly’s Eye. • The HiRes-2 spectrum is consistent with the ‘second knee’ and GZK flux suppression. • The combined monocular HiRes spectra show evidence for a break above 1019.8 eV. The Poisson probability for continuation of the spectrum with unchanged slope from the HiRes monocular data is 1 x 10⁻⁴ .
J.A. Bellido, R.W. Clay, B.R. Dawson, K.M. Simpson University of Adelaide J. Boyer, S. Benzvi, B. Connolly, C. Finley, B. Knapp, E.J. Mannel, A. O’Neil, M. Seman, S. Westerhoff Columbia University J. Belz, M. Munro, M. Schindel Montana State University G. Martin, J.A.J. Matthews, M. Roberts University of New Mexico D. Bergman, L. Perera, G. Hughes, S. Stratton, D. Ivanov, S. Schnetzer, G.B. Thomson, A. Zech Rutgers University N. Manago, M. Sasaki University of Tokyo T. Abu-Zayyad, J. Albretson, G. Archbold, J. Balling, K. Belov, Z. Cao, M. Dalton, A. Everett, J. Girard, R. Gray, W. Hanlon, P. Hüntemeyer, C.C.H. Jui, D. Kieda, K. Kim, E.C. Loh, K. Martens, J.N. Matthews, A. McAllister, J. Meyer, S.A. Moore, P. Morrison, J.R. Mumford, K. Reil,R. Riehle, P. Shen, J. Smith, P. Sokolsky, R.W. Springer, J. Steck, B.T. Stokes, S.B. Thomas, T.D. Vanderveen, L. Wiencke University of Utah J. Amann, C. Hoffman, M. Holzscheiter, L. Marek, C. Painter, J. Sarracino, G. Sinnis, N. Thompson, D. Tupa Los Alamos National Laboratory THANK YOU ! The HiRes Collaboration
The Truth about Ultra-High Energy Cosmic Rays “We’ve established a clear link between UHECR program related activities and evildoers in Iraq.”