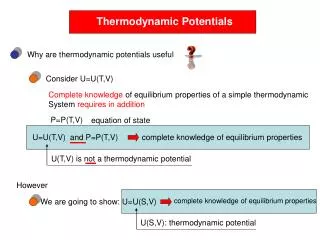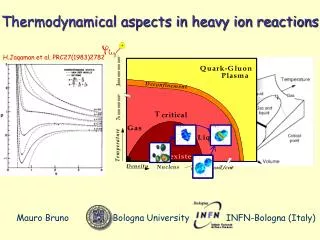
Thermodynamical potentials, summary
Understand the properties of a system, the concept of extensive and intensive properties, and the phase diagrams of pure substances.

Thermodynamical potentials, summary
E N D
Presentation Transcript
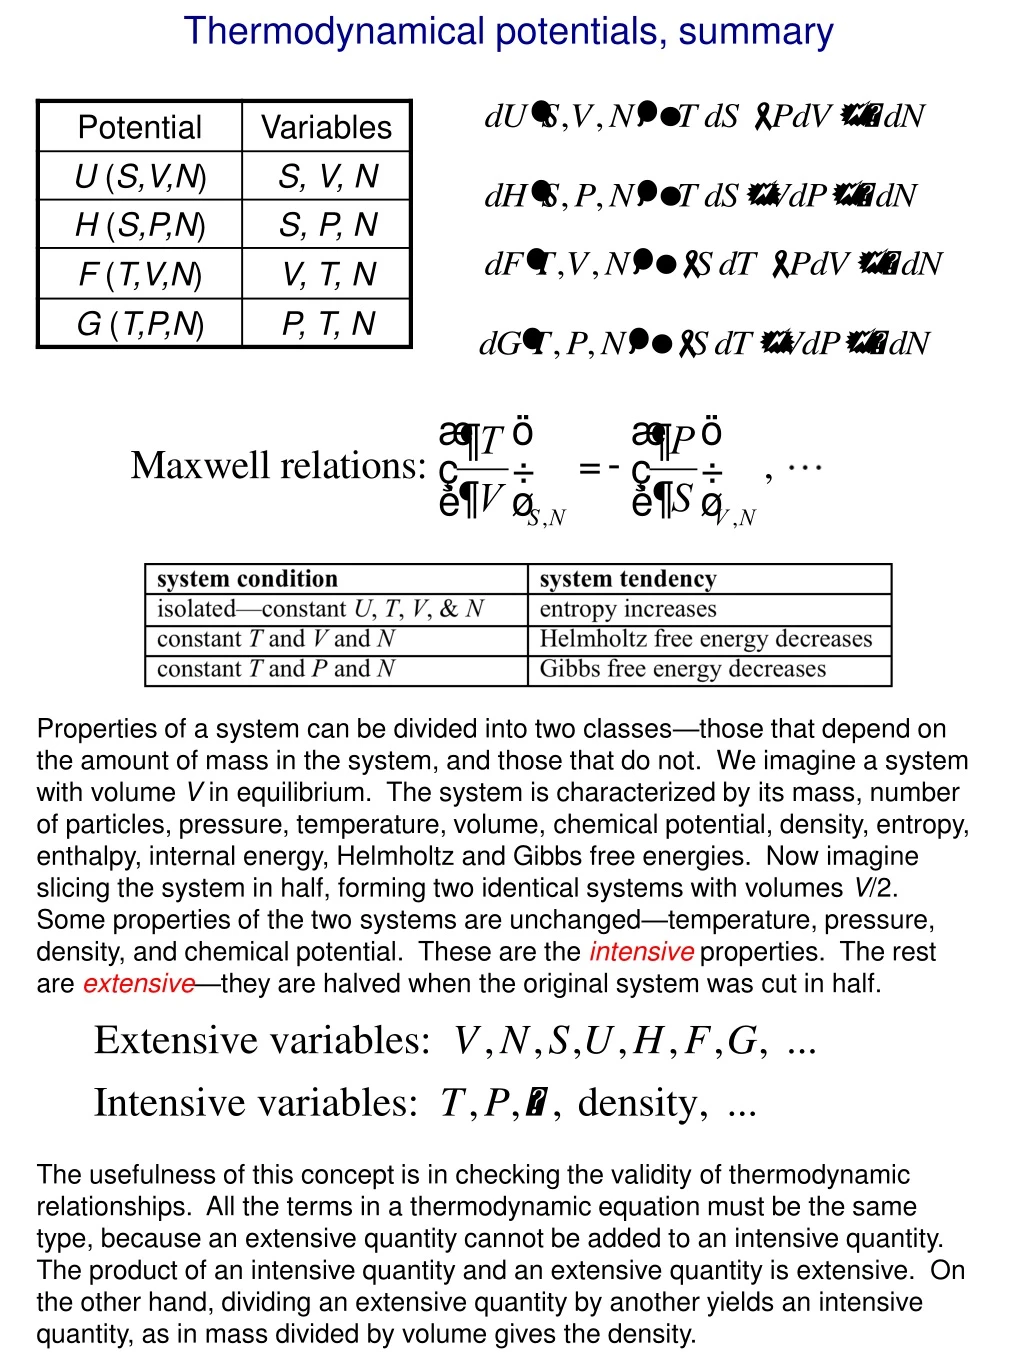
Thermodynamical potentials, summary Properties of a system can be divided into two classes—those that depend on the amount of mass in the system, and those that do not. We imagine a system with volume V in equilibrium. The system is characterized by its mass, number of particles, pressure, temperature, volume, chemical potential, density, entropy, enthalpy, internal energy, Helmholtz and Gibbs free energies. Now imagine slicing the system in half, forming two identical systems with volumes V/2. Some properties of the two systems are unchanged—temperature, pressure, density, and chemical potential. These are the intensiveproperties. The rest are extensive—they are halved when the original system was cut in half. The usefulness of this concept is in checking the validity of thermodynamic relationships. All the terms in a thermodynamic equation must be the same type, because an extensive quantity cannot be added to an intensive quantity. The product of an intensive quantity and an extensive quantity is extensive. On the other hand, dividing an extensive quantity by another yields an intensive quantity, as in mass divided by volume gives the density.
Phases of Pure Substances The generic phase diagram of a substance in the P-T. Every point of this diagram is an equilibrium state; different states of the system in equilibrium are called phases. The lines dividing different phases are called the coexistence curves. Along these curves, the phases coexist in equilibrium, and the system is macroscopicallyinhomogeneous. All three coexistence curves can meet at the triple point – in this case, all three phases coexist at (Ttr , Ptr). Up to now we have dealt almost exclusively with systems consisting of a single phase. Now, we will learn how more complicated, multi-phase systems can be treated by the methods of thermodynamics. The guiding principle will be the minimization of the Gibbs free energy in equilibrium for all systems, including the multi-phase ones.
Coexistence curves Along the coexistence curves, two different phases 1 and 2 coexist in equilibrium (e.g., ice and water coexist at T = 00C and P = 1bar). The system undergoes phase separation each time we cross the equilibrium curve (the system is spatially inhomogeneous along the equilibrium curves). Any system in contact with the thermal bath is governed by the minimum free energy principle. The shape of coexistence curves on the P-T phase diagram is determined by the condition: Otherwise, the system would be able to decrease its Gibbs free energy by transforming the phase with a higher into the phase with lower . Two phases are in a state of diffusive equilibrium: there are as many molecules migrating from 1 to 2 as the molecules migrating from 2 to 1. Also for equilibrium between the phases: - as for any two sub-systems in equilibrium - the phase boundary does not move Though G is continuous across the transition, H demonstrates a step-like behavior: (different phases have different entropy)
Example: the Gas-Liquid Transformation slope of G(T) depends on entropy of the phase Table on page 404 (a very useful source of information) provides the values of H and G for different phases of many substances. The data are provided per mole, at T=298 K and P=1 bar. For example, let’s check that at the boiling point, the values of G for liquid water and water vapor are equal to each other: 0 liquid gas phase transformation S(water) = 70 J/K S(vapor) = 189 J/K
Both diamond and graphite are made entirely out of carbon, as is the more recently discovered buckminsterfullerene (a discrete soccer-ball-shaped molecule containing carbon 60 atoms). The way the carbon atoms are arranged in space, however, is different for the three materials, making them allotropes of carbon. The differing properties of carbon and diamond arise from their distinct crystal structures.
Theoretically predicted phase diagram of carbon A diamond is a transparent crystal of tetrahedrally bonded carbon atoms in a covalent network lattice that crystallizes into the diamond lattice which is a variation of the face centered cubic structure. Diamonds have been adapted for many uses because of the material's exceptional physical characteristics. Most notable are its extreme hardness and thermal conductivity. Above 1,700 °C (1,973 K) in vacuum or oxygen-free atmosphere, diamond converts to graphite; in air, transformation starts at ~700 °C. In diamonds, the bonds form an inflexible three-dimensional lattice, whereas in graphite, the atoms are tightly bonded into sheets, which can slide easily over one another, making the overall structure weaker
Phases of Carbon The phase equilibrium on the P,T-plane is determined by or At normal conditions, graphite is more stable than diamond: G(graphite) = 0, G(diamond) = 2.9 kJ. What happens at higher pressures? Since the molar volume of graphite is greater than the molar volume of diamond, G(graphite) will grow with pressure faster than D(iamond) [we neglected V = V(P)]. D. becomes more stable than G. only at P > 1.5 Gpa. With increasing T, the pressure range of graphite stability becomes wider: The artificial production of diamond from graphite was first achieved around 60 years ago. However, the high pressure and high temperatures needed to produce diamond are among the reasons why graphite is not converted into diamond on a large scale. The process is time-consuming and energy-intensive, because the manufacture of synthetic diamonds requires forcing the inexpensive carbon to change its bonding structure and thus the arrangement of its electrons. G G diamond diamond 2.9 kJ graphite graphite T = 300K 2.9 kJ P = 1 bar 800 1300 1 2 T (K) 300 P (GPa) S(graphite) = 5.74 J/K, S(diamond) = 2.38 J/K,
S T=T1 = const gas gas+liquid liquid liquid+solid solid P First-Order Transitions Paul Ehrenfest classified phase transitions based on the behavior of the thermodynamic free energy as a function of other thermodynamic variables. Under this scheme, phase transitions were labeled by the lowest derivative of the free energy that is discontinuous at the transition. First-order phase transitions exhibit a discontinuity in the first derivative of the free energy with respect to some thermodynamic variable. The various solid/liquid/gas transitions are classified as first-order transitions because they involve a discontinuous change in density, which is the first derivative of the free energy with respect to chemical potential. They also involve a jump in entropy and a latent heat associated with this jump Paul Ehrenfest (1880 – 1933) critical point S Sgas T1 mixed phase Sliquid T TC beyond critical point, gas is indistinguishable from liquid The “evaporation”L is generally greater than the “melting”L (the disorder introduced by evaporation is greater than that introduced by melting).
G T S S = L/T T On the graph G(T) at P,N = const, the slope dG/dT is always negative: P,N = const G solid liquid gas T CP T Note that in the first-order transitions, the G(T) curves have a real meaning even beyond the intersection point, this results in metastability and hysteresis. There is usually an energy barrier that prevents a transition occurring from the higher to the lower phase (e.g., gas, being cooled below Ttr does not immediately condense, since surface energy makes the formation of very small droplets energetically unfavorable). Liquid water can exist at T far lower than the freezing temperature: water in organic cells can avoid freezing down to –200C in insects and down to –470C in plants.