Evaluation
Evaluation. Angela Me, Chief Social and Demographic Statistics Section. Why do evaluate the census?. As all other statistics, data collected through the census include errors To provide users with measures of the quality of the census data to help them to interpret the results

Evaluation
E N D
Presentation Transcript
Evaluation Angela Me, Chief Social and Demographic Statistics Section
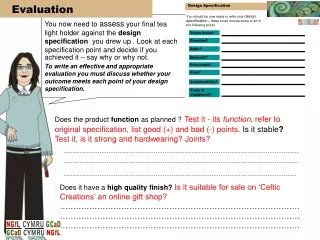
Why do evaluate the census? • As all other statistics, data collected through the census include errors • To provide users with measures of the quality of the census data to help them to interpret the results • To identify as far as possible the type and source of errors to help assisting future censuses • To provide information on the magnitude of errors that can be used to adjust the results and construct the best estimate of census aggregates
Census Evaluation • A comprehensive evaluation should include an assessment of census operations in each of its phases (to improve the next census) • Evaluation should address census process and census results
Common Sources of Errors • Coverage • Omissions • Duplications • Content • Non-responses • Influenced responses • Interview effect • Respondent effect
Omissions Very mobile populations or people who spend a very limited amount of time in their home may not be counted during the census operations Some persons may refuse to participate in the census Incomplete mapping and delineation of enumeration areas Difficult-to-reach populations
Omissions reported by ECE countries in the 2000 census round • Males 15-24, young persons (20-30 years) • Illegal immigrants • Homeless • One-person households, • People who were temporarily absent • Very young children • Some ethnic minorities • Students • Multi-occupied addresses
Duplications People who commute between two different households People on long term staying in institutions Members of defence forces on long-term positioning away from their family Persons who dies before census reference date
Duplications reported by ECE countries in the 2000 census round People who maintain more than one residence Migrants Persons in hospitals Students Some ethnic groups
Non-Response Ifa specific group of people do not answer to a specific question, the aggregated result is biased Non-Response may be classified into three types: • Those unable to respond • Absentees • Refusals
Language Difficulties Some potential respondents may be illiterate or cannot understand the language used in the questionnaires Unless such problems are dealt with, by translating questionnaires and/or engaging multi-language interviewers , bias could arise because those unable to answer may be 'special' in other ways A different linguistic group might, for instance, have completely different lifestyle and customs
Absentees If a person is absent because she or he has moved away for a short period of time (less than 12 months), specific information may not be collected
Refusals Some persons may refuse to respond to some “sensitive questions”
Influenced Response Respondents will sometimes tend to over- or under-estimate due to perceived advantage Example 1: farmers might inflate their land holdings, by always rounding figures upwards, because they believe that the survey results will be used to allocate state aid Example 2: the farmers might deflate, by rounding down, in the hope of minimize taxation
Leading Questions Sometimes response bias is caused through leading questions such as, 'Do you agree that meat eating is barbaric?' Most people like to please and/or will take the easy option of agreeing in the hope of avoiding further questions!
US Survey Example The following questions and results were obtained in an American survey % 'Yes' Have you ever heard the word AFROHELIA? (no such word!) 8 Have you ever heard of the famous writer, John Woodson? (no such writer!) Have you ever heard of the Midwestern Life Magazine? (no such magazine!) Do you recall that, as a good citizen you voted last December in the special election for your state representative? (no election!) 16 25 33 Have you ever heard of the Taft-Pepper Bill concerning veteran's housing (no such bill!) 53 Sometimes this type of bias is called prestige error
Interviewer effect On occasions the very appearance of the enumerator can cause bias For instance, in certain cases, men may give quite different answers when asked questions by another man than they would if a female interviewer were used Similarly, if the setting of the interviewer is inappropriate we may obtain a biased response
Example: Australian Survey Average number of sex partners reported • By women who were watched as they filled in their survey answers: 2.6; • By women who knew they were completely anonymous: 3.4; • By women who thought they were attached to a lie detector: 4.4 Sydney Morning Herald, August 31, 2003
Memory Lapse Respondents may not be able to recall events in the past - in part - in total For example, mothers may not accurately recall the number of their children who died aged less than one month old, over the past 5 years
Root Mean Square Error In general, for all statistics total error, sampling and bias combined, is measured by the rootmean square error, (RMSE) This is defined as
RMSE Bias Sampling error Schematic Representation This is best thought of as the hypotenuse of a right-angled triangle
From small samples to the census Notice that, although a census (100% sample) has no sampling error, the bias may be so large that the RMSE (equal to the bias error in this case) is actually greater than for a sample survey of a moderate size small sample big sample census
How to evaluate census coverage and content? • Internal consistency checks • Comparison of results with other data sources • Post-enumeration survey: independent operation • Re-interview surveys • Demographic analysis • Benchmarking
Comparison of results with other data sources Other data sources: previous census other surveys administrative records Comparison: comparison of overall estimates record checking (limited to special population groups?)
Demographic analysis • Derivation of an expected population estimate taking account of vital registers of births, deaths and net migrants between censuses, as compared with the latest census • Population projections based on the results of the previous census plus data on fertility, mortality and migration from different sources and comparing the projected estimates with the new census results
Demographic analysis • Comparison of two census age distribution based on intercensal cohort survival rates • Estimates of coverage correction factors using regression methods to make the age results from the two censuses mutually consistent Limit the evaluation studies at national level
Benchmarking • To track the contribution of non-responses, editing and imputation to the final data quality • Compare • Non-response rates between censuses • Responses before and after processing It assesses quality It can be produced based on as sample of records
Benchmarking • To track the contribution of non-responses, editing and imputation to the final data quality • Compare • Non-response rates between censuses • Responses before and after processing It assesses quality It can be produced based on as sample of records
Methods used for census evaluation in the 2000 census round in the ECE region
Methods used for census evaluation in the 2000 census round in the ECE region
Methods used for census evaluation in the 2000 census round in the ECE region None of the countries in Central Asia reported evaluation activities
Indicators to measure coverage • Percentage of omissions (in ECE ranging between 0% to 3.95%) • Percentage of duplications (in ECE ranging between 0% to 0.96%) • Gross coverage errors = percentage of omissions + duplications + people erroneously counted • Net coverage errors = percentage of omissions – duplications (in ECE ranging between -3.1% to o.7%)
Communicating quality • NSO should take a proactive role in communicating the reliability of the census data • Users should be fully aware of the limitation and strengths of the final census data