Dynamics of Dissolved Organic Carbon Export from Large Watersheds
Study linking wetland abundance, hydrologic variability, and DOC flux to coastal zones in 17 large river basins using a dynamic hydrological model. Results show good agreement between modeled and observed DOC concentrations and SUVA-254 values. Future work includes incorporating respiration and photo-oxidation processes and coupling model data with remotely-sensed optical parameters for coastal DOC patterns.

Dynamics of Dissolved Organic Carbon Export from Large Watersheds
E N D
Presentation Transcript
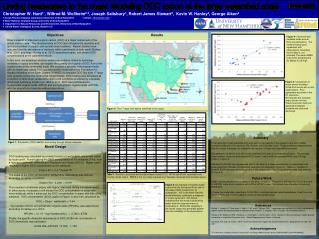
Linking headwaters to the coast: Modeling DOC export at the large watershed scale B41D-0322 Christopher W. Hunt1*, Wilfred M. Wollheim2,3, Joseph Salisbury1, Robert James Stewart2, Kevin W. Hanley4, George Aiken4 1 Ocean Process Analysis Laboratory, University of New Hampshire *contact: chunt@unh.edu 2 Water Systems Analysis Group, University of New Hampshire 3 Department of Natural Resources and Environment, University of New Hampshire 4 United States Geological Survey, Boulder CO Results Figure 2- The 17 large river basins examined in this study. Objectives River transport of dissolved organic carbon (DOC) is a major component of the global carbon cycle. The characteristics of DOC also influence the reactivity and optical properties of aquatic and coastal ocean systems. Recent studies have indicated that the abundance of wetlands within catchments at both small (Buffam et al. 2007) and large (Hanley et al. 2012) watershed scales, can predict DOC concentrations at the catchment mouth. In this work, we examined whether wetland abundance, linked to hydrologic variability in space and time, can explain the quantity and quality of DOC flux to the coastal zone at the continental scale. We coupled a dynamic hydrological model with an empirically-based DOC quantity/quality model within the Framework for Aquatic Modeling of the Earth System (FrAMES) to simulate DOC flux from 17 large river systems across the continental United States. DOC loading was simulated as a function of land cover (wetlands%) and runoff conditions predicted by a spatially distributed hydrology model from 1980 to 2011. DOC was partitioned into hydrophobic organic acids (HPOA) and nonhydrophobic organic acids (nHPOA), with the proportions driven by wetland abundance. Figure 4- Observed and modeled mean-annual DOC concentrations. The model showed good agreement with observations (excluding the St. Mary’s, not pictured).The mean RMSE of all rivers excepting the St. Mary’s is 2.9 mg/l. Figure 5- Comparison of mean-annual modeled SUVA-254 results with in-situ observations. Poor agreement was seen in the St. Lawrence, Rio Grande and Colorado rivers (shown in blue). These rivers also had poor agreement between modeled and observed discharge. Figure 1- Schematic of DOC addition and routing through stream networks. Table 1- Results of observed and modeled mean annual DOC, HPOA and SUVA, calculated from monthly model output. RMSE is the root mean squared error between observed and modeled values. Summary • The hydrologic model predicted discharge well for the majority of the studied rivers, with notable exceptions being the St. Lawrence, Rio Grande, and Colorado rivers. These exceptions represent river that are heavily managed, are located in dry regions, or have very long residence times. • Excepting the St Mary’s river, the model predicted DOC well on a mean-annual basis. The average offset between observed and modeled DOC was 0.1 mg/l, while the average RMSE was 2.9 mg/l (Table 1, Figure 4). • Modeled SUVA-254 also agreed well with in-situ data on a mean-annual basis for watersheds with good agreement between modeled and observed river discharge (Figure 5). However, variability in monthly SUVA data was generally greater in the model output than in the observed data (see example in Figure 3). • Future Work • Add in processing terms for respiration and photo-oxidation. Respiration will remove DOC (in the form of nHPOA), while photo-oxidation will shift the HPOA% lower. This should have the effect of reducing SUVA-254. • Couple the model data, specifically SUVA-254, to remotely-sensed optical parameters to test how river inputs of DOC are linked to patterns of DOC in the coastal ocean. • Model Design • DOC loading was calculated as a linear function of wetlands%, which was varied by local runoff. Runoff altered the DOC concentration at 0% wetlands (Y-Int, from a forested catchment relationship in Raymond and Saiers (2010)). Higher runoff resulting in higher DOC concentration at 0% wetlands: • Y-Int=1.83 + (1.4 * Runoff 0.6) • The slope of the DOC concentration-Wetlands% relationship was derived according to Hanley et al 2012: • Slope=(Yint - 4.244) / -2.918 • This resulted in shallower slopes with higher intercepts during increased runoff. In other words, increased runoff diluted the DOC concentration in areas with more wetlands, while it enhanced the DOC concentration in areas with little or no wetlands. DOC concentration (DOCLocalIn in Figure 1) was then calculated as: • DOC = Slope * wetlands% + Y-Int • The fraction of DOC as hydrophobic organic acids (HPOA%) was determined according to Hanley et a. 2012: • HPOA% = ((1.19 * log10(wetlands%)) + 3.762) / 8.792 • Finally, the specific ultraviolet absorbance of DOC at 254 nm, an indicator of DOC aromaticity, was estimated: • SUVA-254=(HPOA% * 8.792) - 1.126 Figure 3- An example of monthly model output from the Kennebec River, with in-situ data (USGS Loadrunner) for comparison. N-S is the Nash-Sutcliffe model efficiency coefficient, a measure of model agreement, with N-S>0 indicating that the model is performing better than the observed mean of observations. SUVA-254 variability in the model output was generally greater than the variability of the observations. References Buffam, I., Laudon, H., Temnerud, J., Morth, C.-M., and K. Bishop. 2007. Landscape-scale variability of acidity and dissolved organic carbon during spring flood in a boreal stream network. J. Geophys. Res. (112) doi: 10.1029/2006JG000218. Hanley, K.W., Wollheim, W.M., Salisbury, J., Huntington, T. and G. Aiken. 2012. Controls on dissolved organic carbon quantity and quality in large North American rivers. Global Biogeochemical Cycles In Review Raymond, P.A. and J.E. Saiers. 2010. Event controlled DOC export from forested watersheds. Biogeochemistry 100: 197-209. Acknowledgments This work was funded by National Aeronautics and Space Administration grants NNX09AU89G and NNH04AA62I .