
Sample Proportion and the Normal Approximation
E N D
Presentation Transcript
Chapter 9.2: Sample Proportion Mr. Lynch AP Statistics
Sample Proportions • In what year did Christopher Columbus “discover” America? • What is our classes p-hat? • 210 of the 501 sampled in a Gallup Poll knew this.
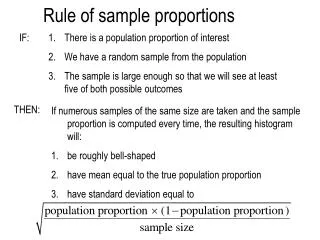
Rules of Thumb • RULE OF THUMB 1: • You can only use the standard deviation formula of the population is large enough. Specifically N 10n • RULE OF THUMB 2: • You can only use A NORMAL APPROXIMATION to the propoprtion sampling distribution with values of n and p if np10 AND nq10
The Normal Approximation • When n is LARGE, the Sampling Distribution of is approximately normal • EXAMPLE 9.7: APPLYING TO COLLEGE • SRS OF n = 1500; p = .35 • Check Rules of Thumb • P(the random sample will produce a percentage within 2% of the actual population proportion of 35%)
The Normal Approximation • Draw it! • Standardize the p-hat values • Re-draw with the new z-scores • Calculate Area with table or normalcdf
SURVEY UNDERCOVERAGE • EXAMPLE 9.8 SURVEY UNDERCOVERAGE? • 11% US adults are black • A recent national sample of 1500 adults had only a 9.2% black representation • Should we suspect racial discrimination or some sort of under-coverage?
SURVEY UNDERCOVERAGE • Rules of Thumb • Draw it! • Standardize the p-hat value • Re-draw with the new z-score • Calculate Area with table or normalcdf