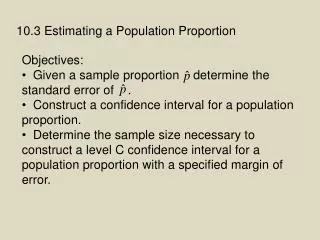
10-3 Estimating a Population Proportion
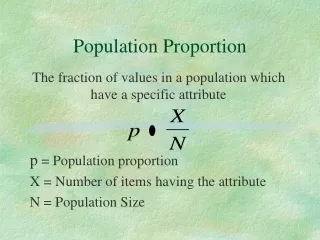
10-3 Estimating a Population Proportion. Recall from Chapter 9. Remember n is the sample size and p is the population parameter. So. Note: You ALWAYS have to check the conditions when creating a CI, even if the problem doesn’t ask you to do so!!. Standard Error.

10-3 Estimating a Population Proportion
E N D
Presentation Transcript
10-3 Estimating a Population Proportion
Remember n is the sample size and p is the population parameter.
So... Note: You ALWAYS have to check the conditions when creating a CI, even if the problem doesn’t ask you to do so!!
Standard Error Since we don’t know p, we will use phat to estimate p. The standard deviation will be called the Standard Error (SE) of phat. Think of SE as an estimate of the standard deviation of the sampling distribution.
Using : Find z* for a 95% CI Find z* for a 99% CI Find z* for a 70% CI Find z* for a 85% CI
In May 2002, the Gallup Poll asked 537 randomly sampled adults the question “Generally speaking, do you believe the death penalty is applied fairly or unfairly in this country today?” Of these, 53% answered “Fairly” and 7% said they didn't know. What can we conclude from this survey? Construct a 95% confidence interval for the proportion p of U.S. Adults who think the death penalty is applied fairly. A confidence Interval for a ProportionOne-proportion Z Interval
In May 2002, the Gallup Poll asked 537 randomly sampled adults the question “Generally speaking, do you believe the death penalty is applied fairly or unfairly in this country today?” Of these, 53% answered “Fairly” and 7% said they didn't know. What can we conclude from this survey? A confidence Interval for a ProportionOne-proportion Z Interval Steps from p.631 Inference Toolbox 1) Parameter 2) Conditions 3) Calculations 4) Interpretation “3 C’s”: conclusion, connection, & context
Calculating a confidence interval for a population proportion using the calculator Stat tests A:1-PropZInt x = number of successes n = sample size C-Level: enter the confidence level as an integer such as 90, 95, or 99 Press enter to Calculate Using the Calculator
Binge DrinkingIn a 2001 survey of 10,904 US college undergraduate students, 2486 students were classified as binge drinkersCalculate a 99% CI. We are 99% confident that the proportion of college undergraduates who engaged in frequent binge drinking lies between 0.218 and 0.238.
How Proportion CI’s Behave The margin of error gets smaller when: • z* gets smaller (Confidence level decreases) • phat gets further from 0.5 • n gets larger
Caution: Other Types of Error • Remember that the margin of error in this confidence interval includes only random sampling error! That is error due to chance variation in randomized data production. • Other sources of error (referred to as non-sampling error) such as response bias, nonresponse, undercoverage, designs other than SRS that we treat like an SRS, etc. are not included in our margin of error.
More Cautions • Data must be an SRS from the population. Different methods are needed for different sampling designs. We will only study CI’s from an SRS. • There is no correct method for inference from data haphazardly collected with bias of unknown size. GIGO • Outliers can distort results. • The shape of the population matters. Check your conditions! • The size of the sample determines the margin of error, not the size of the population (as long as the N ≥ 10n).
A company has received complaints about it s customer service. They intend to hire a consultant to carry out a survey of customers. Before contacting the consultant, the company president wants some idea of the sample size that she will be required to pay for. The president wants to estimate the proportion p of customers who are satisfied. She decides she wants the estimate to be within 3% at a 95% confidence interval. Approximate an appropriate sample size. Determining Sample Size
Determining Sample Size A company has received complaints about it s customer service. They intend to hire a consultant to carry out a survey of customers. Before contacting the consultant, the company president wants some idea of the sample size that she will be required to pay for. The president wants to estimate the proportion p of customers who are satisfied. She decides she wants the estimate to be within 3% at a 95% confidence interval. Approximate an appropriate sample size. Remember to always round n up!