10.3 Estimating a Population Proportion
10.3 Estimating a Population Proportion. Objectives: Given a sample proportion determine the standard error of . Construct a confidence interval for a population proportion.

10.3 Estimating a Population Proportion
E N D
Presentation Transcript
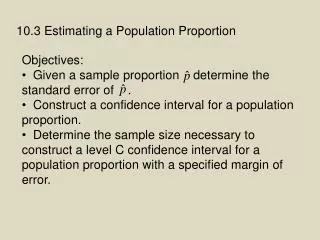
10.3 Estimating a Population Proportion • Objectives: • Given a sample proportion determine the standard error of . • Construct a confidence interval for a population proportion. • Determine the sample size necessary to construct a level C confidence interval for a population proportion with a specified margin of error.
A level C confidence interval for a parameter has two parts: • A confidence interval calculated from the data, usually of the form: estimate ± margin of error. • A confidence level C, which gives the probability that the interval will capture the true parameter value in repeated samples. That is, the confidence is the success rate for the method.
We choose the confidence level. A level of 90% or higher is usually chosen because we want to be quite sure of our conclusions. WE will use C to stand for the confidence level in decimal form. For example, a 95% confidence level corresponds to C = 0.95. z* - memorize - the top three usually used: 90% confidence use 1.645 95% confidence use 1.960 99% confidence use 2.576
Conditions for Inference about a Proportion Inference is based on the sampling distribution of a statistic (described in 9.2) Now we don’t know p, so we don’t know whether np and n(1 – p) are 10 or greater. In large samples, will be close to p. Therefore, we replace p with in determining the values of np and n(1 – p).
The standard deviation is replaced with the standard error of to get a confidence interval of the form estimate ± z*SEestimate
Conditions for Inference about a Proportion • SRS The data are an SRS from the population of interest. • Normality For a confidence interval, n is so large that both the count of successes and the count of failures are 10 or more. • Independence Individual observations are independent. When sampling without replacement, the population is at least 10 times as large as the sample.
Step-by-step example In May 2006, the Gallup Poll asked 510 randomly sampled adults the question “Generally speaking, do you believe the death penalty is applied fairly or unfairly in this country today?” Of these, 60% answered “Fairly”, 35% said “Unfairly” and 4% said they didn’t know. Question; From this survey, what can we conclude about the opinions of all adults?
To answer this question build a confidence interval for the proportion of all US adults who believe the death penalty is applied fairly. Step 1: Identify the parameter you wish to estimate, identify the population about which you wish to make statements, choose and state a confidence interval. I want an interval with 95% confidence that will contain the true proportion of US adults who think the death penalty is applied fairly. I have a random sample of 510 adults.
Step 2: Think about assumptions and check conditions Since Gallup phone randomly selected adults I can assume independence. There are no details on how the randomization was done but I trust it, so randomization is satisfied. There are many more US adults than the 510 that were sampled so the sample is less than 10% of the population. n and n(1 – ) are both greater than 10 ALL conditions are met so I can use the Normal model.
Step 3: Calculations 3a) Find the standard error n = 510, = 0.60 3b) Find the margin of error For a 95% confidence interval, use 1.96 for z*. 3c) Identify the confidence interval. The 95% confidence interval is 0.60 ± 0.043 or (0.557, 0.643)
Conclusion I am 95% confident that between 55.7% and 64.3% of all US adults think that the death penalty is applied fairly.
Do Now: (from your book 10.51) When trying to hire managers and executives, companies sometimes verify the academic credentials described by the applicants. One company that performs these checks summarized their findings for a six-month period. Of the 84 applicants whose credentials were checked, 15 had lied about having a degree.
a) Find the proportion of applicants who lied about having a degree, and find the standard error.
b) Consider these data to be a random sample of credentials from a large collection of similar applicants. Calculate and interpret a 90% confidence interval for the true proportion of applicants who lie about having a degree.
Construct the margin of error Identify the confidence interval. The 90% confidence interval is 0.179 ± 0.06909 (.10991, .24809) I am 90% confident that between 11% and 24.8% of applicants lie about having a degree.