8.2 - Estimating a Population Proportion
8.2 - Estimating a Population Proportion. Learning Targets. I can construct and interpret a confidence interval for a population proportion. I can determine critical values for calculating a confidence interval.

8.2 - Estimating a Population Proportion
E N D
Presentation Transcript
Learning Targets • I can construct and interpret a confidence interval for a population proportion. • I can determine critical values for calculating a confidence interval. • I can carry out the steps in constructing a confidence interval for a population proportion. • I can determine the sample size required to obtain a level C confidence interval for a population proportion with a specified margin of error. • I can understand how the margin of error of confidence interval changes with the sample size and the level of confidence C. • I can understand why each of the three inference conditions is important.
First Task: • I can construct and interpret a confidence interval for a population proportion.
Back to our pennies: • As a class, you will decide how to select an SRS of pennies from a jar. • Each of you will then take an SRS of approximately 50 pennies. • Separate the pennies into two piles: those that are more than 10 years old and those that are not. Count the number in each pile.
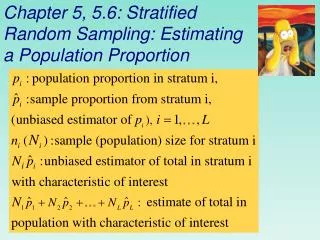
Conditions for Estimating p • Inference is based on sampling distribution of a statistic. • Overview of the important properties for the sampling distribution of p-hat: • Shape - if n is large enough that both np and n(1-p) are at least 10 the sampling distribution of p-hat is approximately Normal • Center - p-hat is an unbiased estimator of p, so the mean is p • Spread - the standard deviation of p-hat is only found if the population is at least 10 times as large as the sample These are used to check that we are able to do calculations about our sample!
Conditions for calculating a confidence interval: • Random - was the sample selected correctly randomly? • Normal - are the Normal conditions met for a sampling distribution of proportions? • Independent - is it sampling without replacement? If so, the 10% condition must be satisfied. • If all 3 are met, then you may calculate a confidence interval!
Check whether each of the conditions are met for calculating a confidence interval for the population proportion p. • An AP Statistics class at a large high school conducts a survey. They ask the first 100 students to arrive at school one morning whether or not they slept at least 8 hours the night before. Only 17 students said, “Yes.”
Second Task: • I can construct and interpret a confidence interval for a population proportion. • I can determine critical values for calculating a confidence interval.
Constructing the confidence interval for p statistic + (critical value)(standard deviation of statistic)
Constructing the confidence interval for p statistic + (critical value)(standard deviation of statistic)
How to Find z* • If asked to find the 86% confidence level, you are looking for the middle 86% of the area under the Normal curve. • Sketch a picture of this. • Then lets review how to find z* in our calculator.
Again: only use when the number of successes and failures are at least 10 and the population is at least 10 times as large as the sample ^ ^ ^ Our formula: statistic + (critical value)(standard deviation of statistic) is now: This is known as the One-Sample z Interval for a Population Proportion (It is now directly on the formula sheet)
Third Task: I can carry out the steps in constructing a confidence interval for a population proportion.
Four Step Process(absolutely mandatory and expected on the exam for confidence intervals) • State: What parameter do you want to estimate and at what confidence level? • Plan: Identify the appropriate inference method and check conditions. • Do: If the conditions are met, perform calculations. • Conclude: Interpret your interval in the context of the problem.
According to an article in the San Gabriel Valley Tribune (02/13/2003), “Most people are kissing the right way.” That is, according to the study, the majority of couples tilt their heads to the right when kissing. In the study, a researcher observed a random sample 124 couple kissing in various public places and found that 83/124 (66.9%) of the couples tilted to the right. Construct and interpret a 95% confidence interval for the proportion of all couples who tilt their heads to the right when kissing. STATE PLAN DO CONCLUDE
State: What parameter do you want to estimate and at what confidence level? We want to estimate p = the true proportion of couples who tilt their heads to the right when kissing at the 95% confidence level.
Plan: Identify the appropriate inference method and check conditions. • Conditions to check for a one-sample z interval for p: • Random - yes, the researcher selected a random sample • Normal - np = 83 > 10 and n(1 - p) = 41 > 10 • Independent - The number of couples in the population is at least 10(124) = 1240. • All conditions are met ^ ^
Do: If the conditions are met, perform calculations. ^ ^ ^ = 0.669 + 0.083 = (0.586, 0.752)
Conclude: Interpret your interval in the context of the problem. • We are 95% confident that the interval from 0.586 to 0.752 captures the true proportion of couples who tilt their heads to the right when kissing.
Calculator Time • the calculators do a one sample z interval for a population proportion • YOU MUST STILL SHOW THE FORMULA AND THE NAME OF THE TEST ON THE EXAM. • If you use the calculator and do it wrong you will loose all credit because you have no method identified or work shown.
th Learning Target I can determine the sample size required to obtain a level C confidence interval for a population proportion with a specified margin of error.
Before conducting a study you need to determine how large your sample size needs to be. Which part of the formula for a confidence interval is the margin of error? ^ ^ How?
Where does z* come from? What about p-hat? ^ ^ Two ways to estimate p-hat: 1. Use an educated guess from past experiences with similar studies 2. Use 0.5 because the ME will be the largest Why?
Suppose that you wanted to estimate p = the true proportion of students at your school who have a tattoo with 95% confidence and a margin of error of no more than 0.10. Determine the number of students needed for your sample.