Graphing Refresher: Constructing Good Graphs Together
80 likes | 172 Vues
Today's learning goal is to refresh our graphing skills by focusing on efficient communication, proper tools, and essential elements of a good graph. Students will work in pairs to select and graph observable characteristics like shoe color or eye color. They will organize data, construct good graphs using the collected data, and follow specific tasks from their math textbooks. Get ready to enhance your graphing abilities!

Graphing Refresher: Constructing Good Graphs Together
E N D
Presentation Transcript
Today’s Learning Goal • We are not learning anything ‘new’ today, but we are refreshing our understanding of how to graph. The skills we are focusing on are: • Remembering that the number one goal of a graph is to efficiently communicate information that is easy to understand. • Remembering to use the proper tools when constructing a graph. • Remembering our checklist of “Good Graph” elements
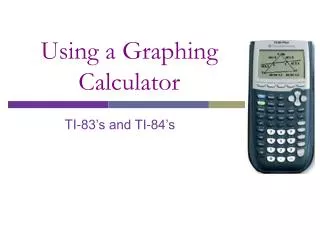
What tools do we need to construct a graph? • Common sense and effort. • A pencil. We work in pencil first. • Graph paper … it makes life easier • A Ruler • A RULER • That sort of long thing that makes straight lines … what’s it called? Oh ya! A RULER!!!!!! • Coloured pencils to make it look pretty.
What does a good graph look like? A PROPER SCALE A TITLE COLOUR BAR LABELS AXIS LABELS EVENLY SPACED BARS
Your Task: • Get a partner. • Get all the necessary tools you need to complete a “good graph”. • Select a characteristic that you can observe and graph in the class. • Colour of shoes • Eye Colour • Hair Colour • Colour of shirt
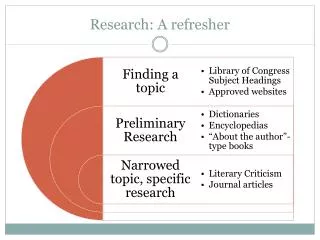
Organizing your Data • Create a table with sensible categories.
Using Your Data • Examine you the data you have collected and construct a “Good Graph” • Both partners should construct a graph.
All Done? • Grade 4s: Math Textbook • p. 56+ 57 A-E and #1 a,b,c,d • Grade 5s: Math Textbook • p. 60+61 A-D and #1-3