Download
1 / 23
240 likes | 404 Vues
Alternative Energy Propulsion in Short Route Ferries. Case Study: Halifax Harbour Ferries Presented By: E.Y.E. Marine Consultants. What is meant by “ Alternative Energy ” ?. Hybrid. Green Energy. Reducing Emissions. But Does it Pay?. What we Are Comparing?. vs. vs. Diesel Propulsion.

E N D
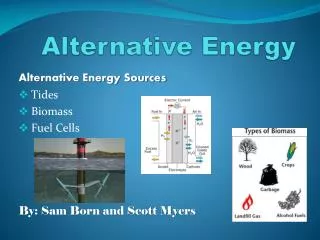
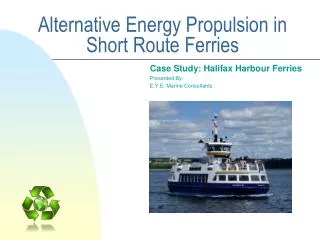
Alternative Energy Propulsion in Short Route Ferries Case Study: Halifax Harbour Ferries Presented By: E.Y.E. Marine Consultants
What is meant by “Alternative Energy”? Hybrid Green Energy Reducing Emissions But Does it Pay?
What we Are Comparing? vs. vs. Diesel Propulsion Battery Hybrid • Diesel Engines • Main source of power from diesel fuel • No secondary sources of power • Battery Powered • Main source of power from Battery Bank • No secondary sources of power • Plug into electrical grid during stops and over night • Diesel Electric • Main source of power from Battery Bank • Secondary sources of power from diesel generator • Plug into electrical grid during stops and over night
So Why bother? • Consider ferry uses 15L/Trip of fuel • Ferry operates 67 trips a day • That’s 1005 Litres of Diesel Fuel per day. • @ $1/L that’s $1005/day Total Savings of $503.30/day • Amount of energy used per day 1005L x 10.4 kW-h/L = 10452 kW-h/Day • Diesel engine operates at approximately 40% efficiency = 10452 x .4 = 4180.8 kW-h/Day • Average rate of power from NS power is $0.12/kW-h • Total operating cost = 4180.8 x 0.12 = $501.70
Battery Propulsion Total Required Capacity: Diesel = 10451 kW-h Battery = 2626 kW-h
The Breakdown Total Power Used = 4238 kW-h/Day Total Rechargeable Power = 1620 kW-h/Day Available Regeneration Rate 600V x 250Amps = 150 kW Off Hours Recharge required = 2625 kW-h/Day
The Bad Actual Battery Capacity Needed: AGM = 6562.5 kW-h Li-Ion = 4375 kW-h Installation Cost: AGM = $ 131,670.00 (@ $20/kW-h every 8 years) Li-Ion = $ 7,000,000.00 (@ $1600/kW-h Life time)
The Ugly Actual Battery Size Needed: AGM = 321,125 kg or 87.5 m^3 Li-Ion = 26,840 kg or 13.7 m^3
The Ugly Cont’d Charging Constraints: 600V x 250 Amps = 150 kW Max. Charge Off Duty 150 kW x 6 Hours x 2 chargers = 1800 kW-h We Require 2625 kW-h
Now Where? What are the things we need to change? • Need to reduce the Battery Bank Size. • Reduce the Battery Bank Capacity. • Reduce the installation costs for the battery bank.
SOLUTION? HYBRID!
The Breakdown 1 Generator: Required Battery Capacity = 1660 kW-h Installed Capacity: AGM = 4150 kW-h Li-Ion = 2667 kW-h 2 Generators: Required Battery Capacity = 1000 kW-h Installed Capacity: AGM = 2500 kW-h Li-Ion = 1667 kW-h
30 Year Cost Comparison 1 Generator 2 Generators
The Physical Restrictions Actual Battery Size Needed: AGM = 207,500 kg or 53.3 m^3 Li-Ion = 16,973 kg or 8.7 m^3 Li-Ion Only Solution
30 yr. Savings of $ 790,458.40 Emission Savings of CO2 = 360.5 Tons/yr Nox = 5.96 Tons/yr Less exposed to fluctuations in fuel prices More exposed to fluctuations in electricity prices. Still very high installation Costs Additional costs for charging infrastructure required at dockside. The Good and Bad The Good The Bad
From Here? • Further analysis required into ferry operating loads. • Further study into optimal generator size and quantity. • Discuss possible safety issues with regard to stored battery capacity. • Look for better battery technology to improve energy densities. • Determine Charging infrastructure requirement and cost at dockside. • Collect firm data with regards to purchasing bulk energy and off peak recharging.
Conclusion • Technology is viable today with modest savings. • Further savings possible with development of emission credits. • Government incentives to promote and off set large installation costs. • Further reduction in price with bulk purchases of power and off peak recharging. • Satisfaction of saving emissions and helping environment.
For a copy of this presentation please visit our latest news section at our website: www.eyemarine.com E.Y.E. Marine ConsultantsSuite 1, 327 Prince Albert RoadDartmouth, Nova Scotia, CanadaB2Y 1N7Phone: (902) 463.8940Fax: (902) 463.6319Email: eye@eyemarine.com